Exploring open source water science and management
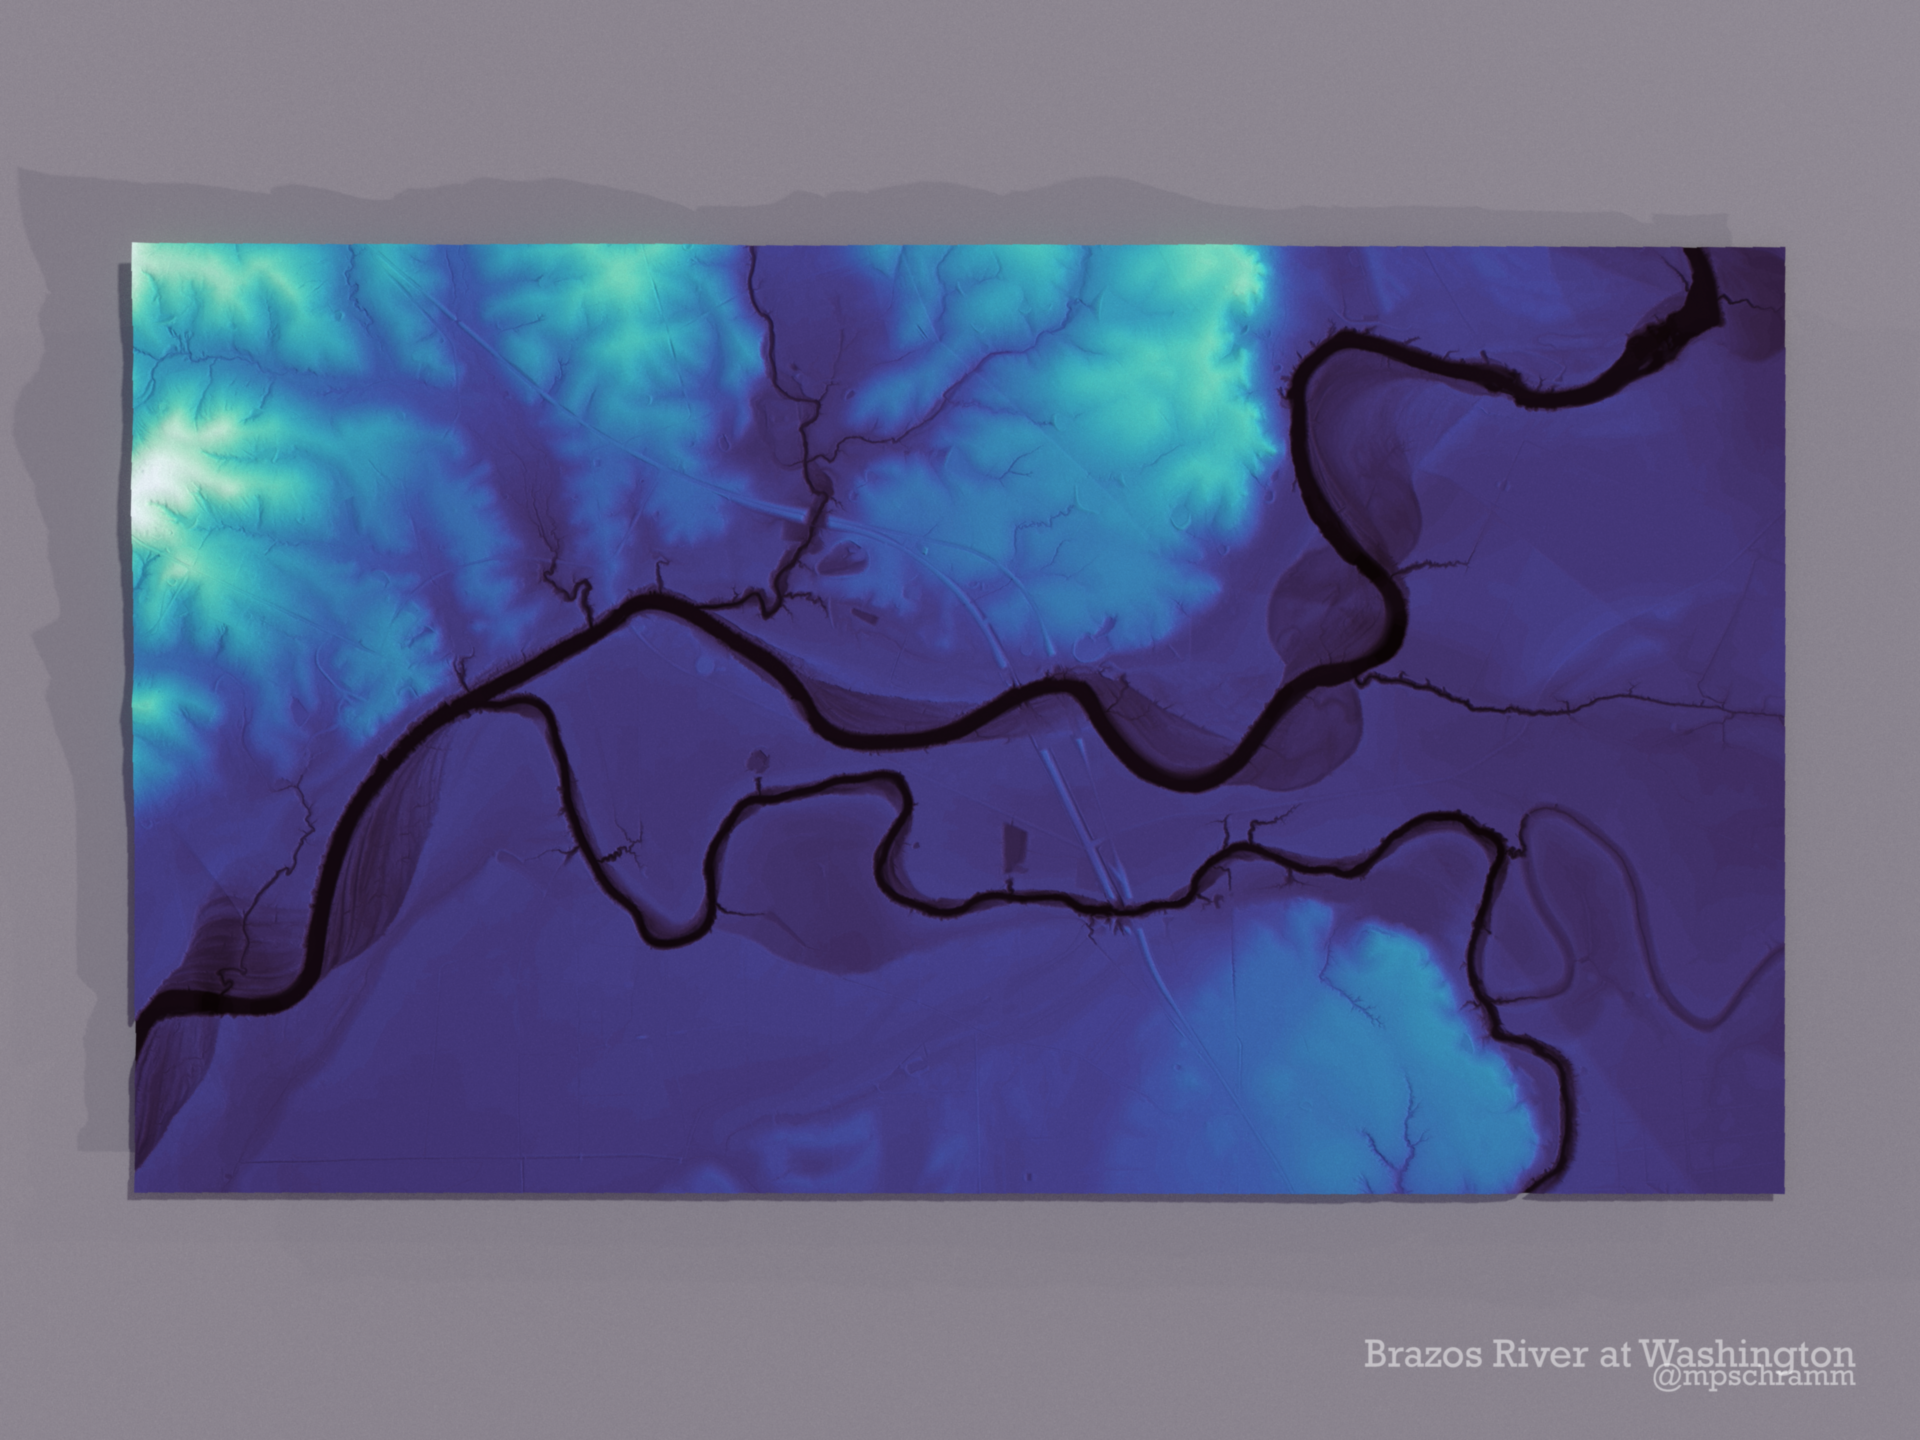
Relative elevation models using lidar, R, and Python
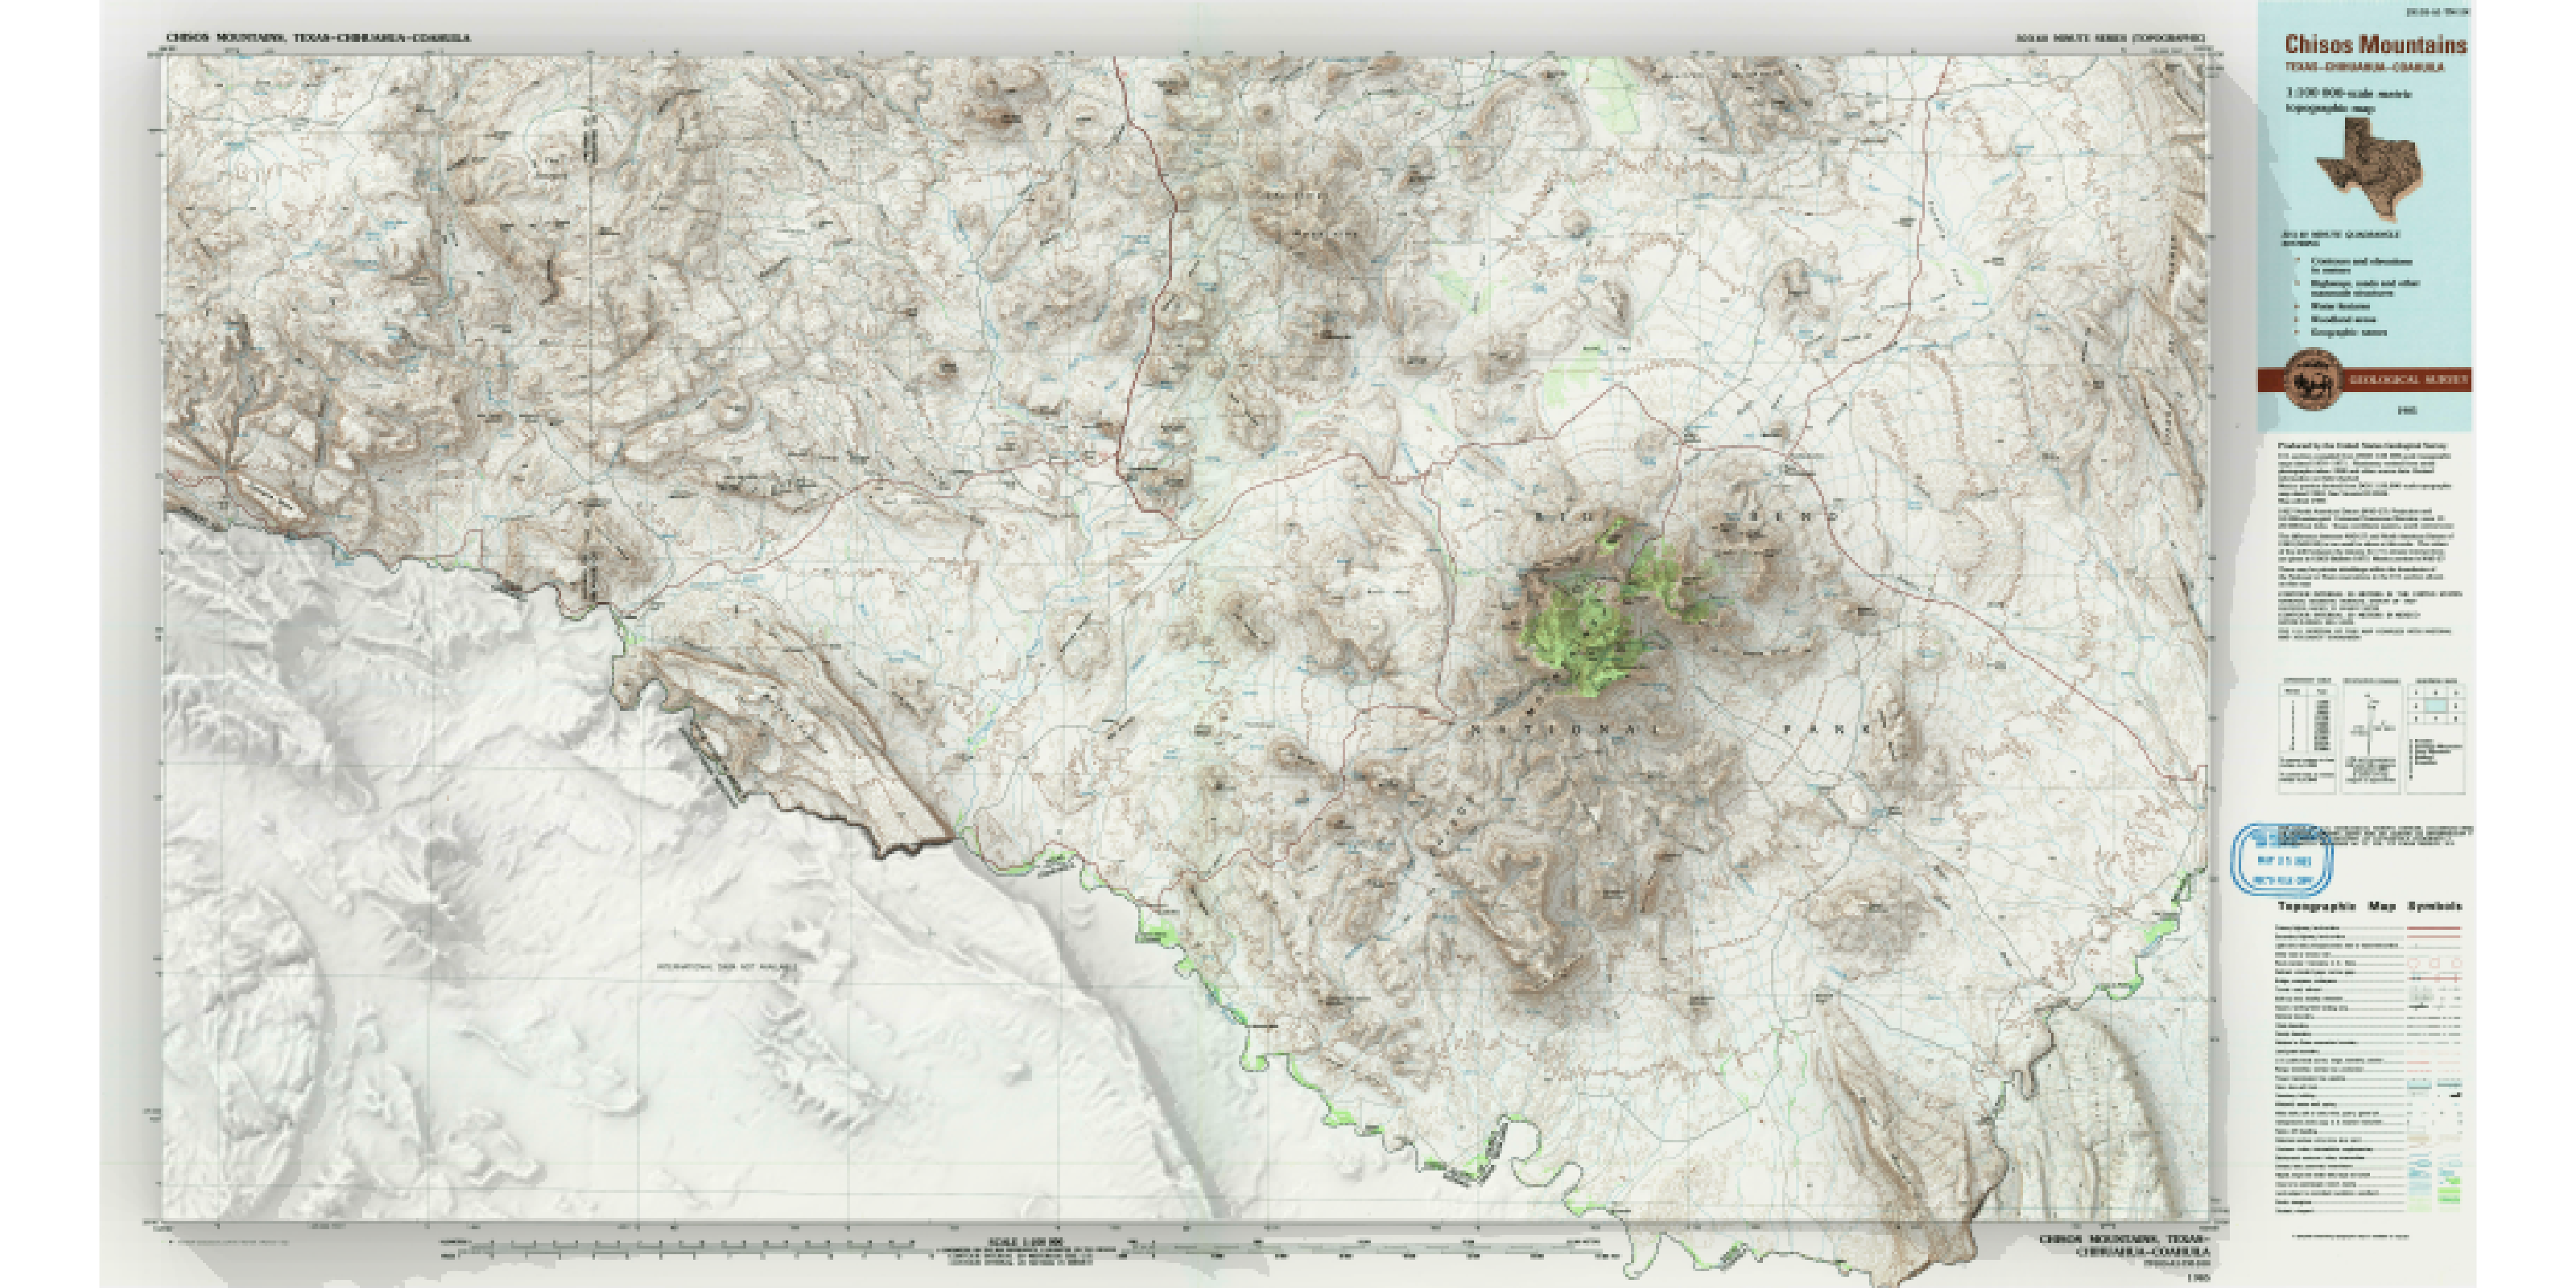
Pretending I can make beautiful maps!
Drought condition gifs
Playing with drought maps.
Plotting drought conditions
Historic drought conditions have set in across much of the US.
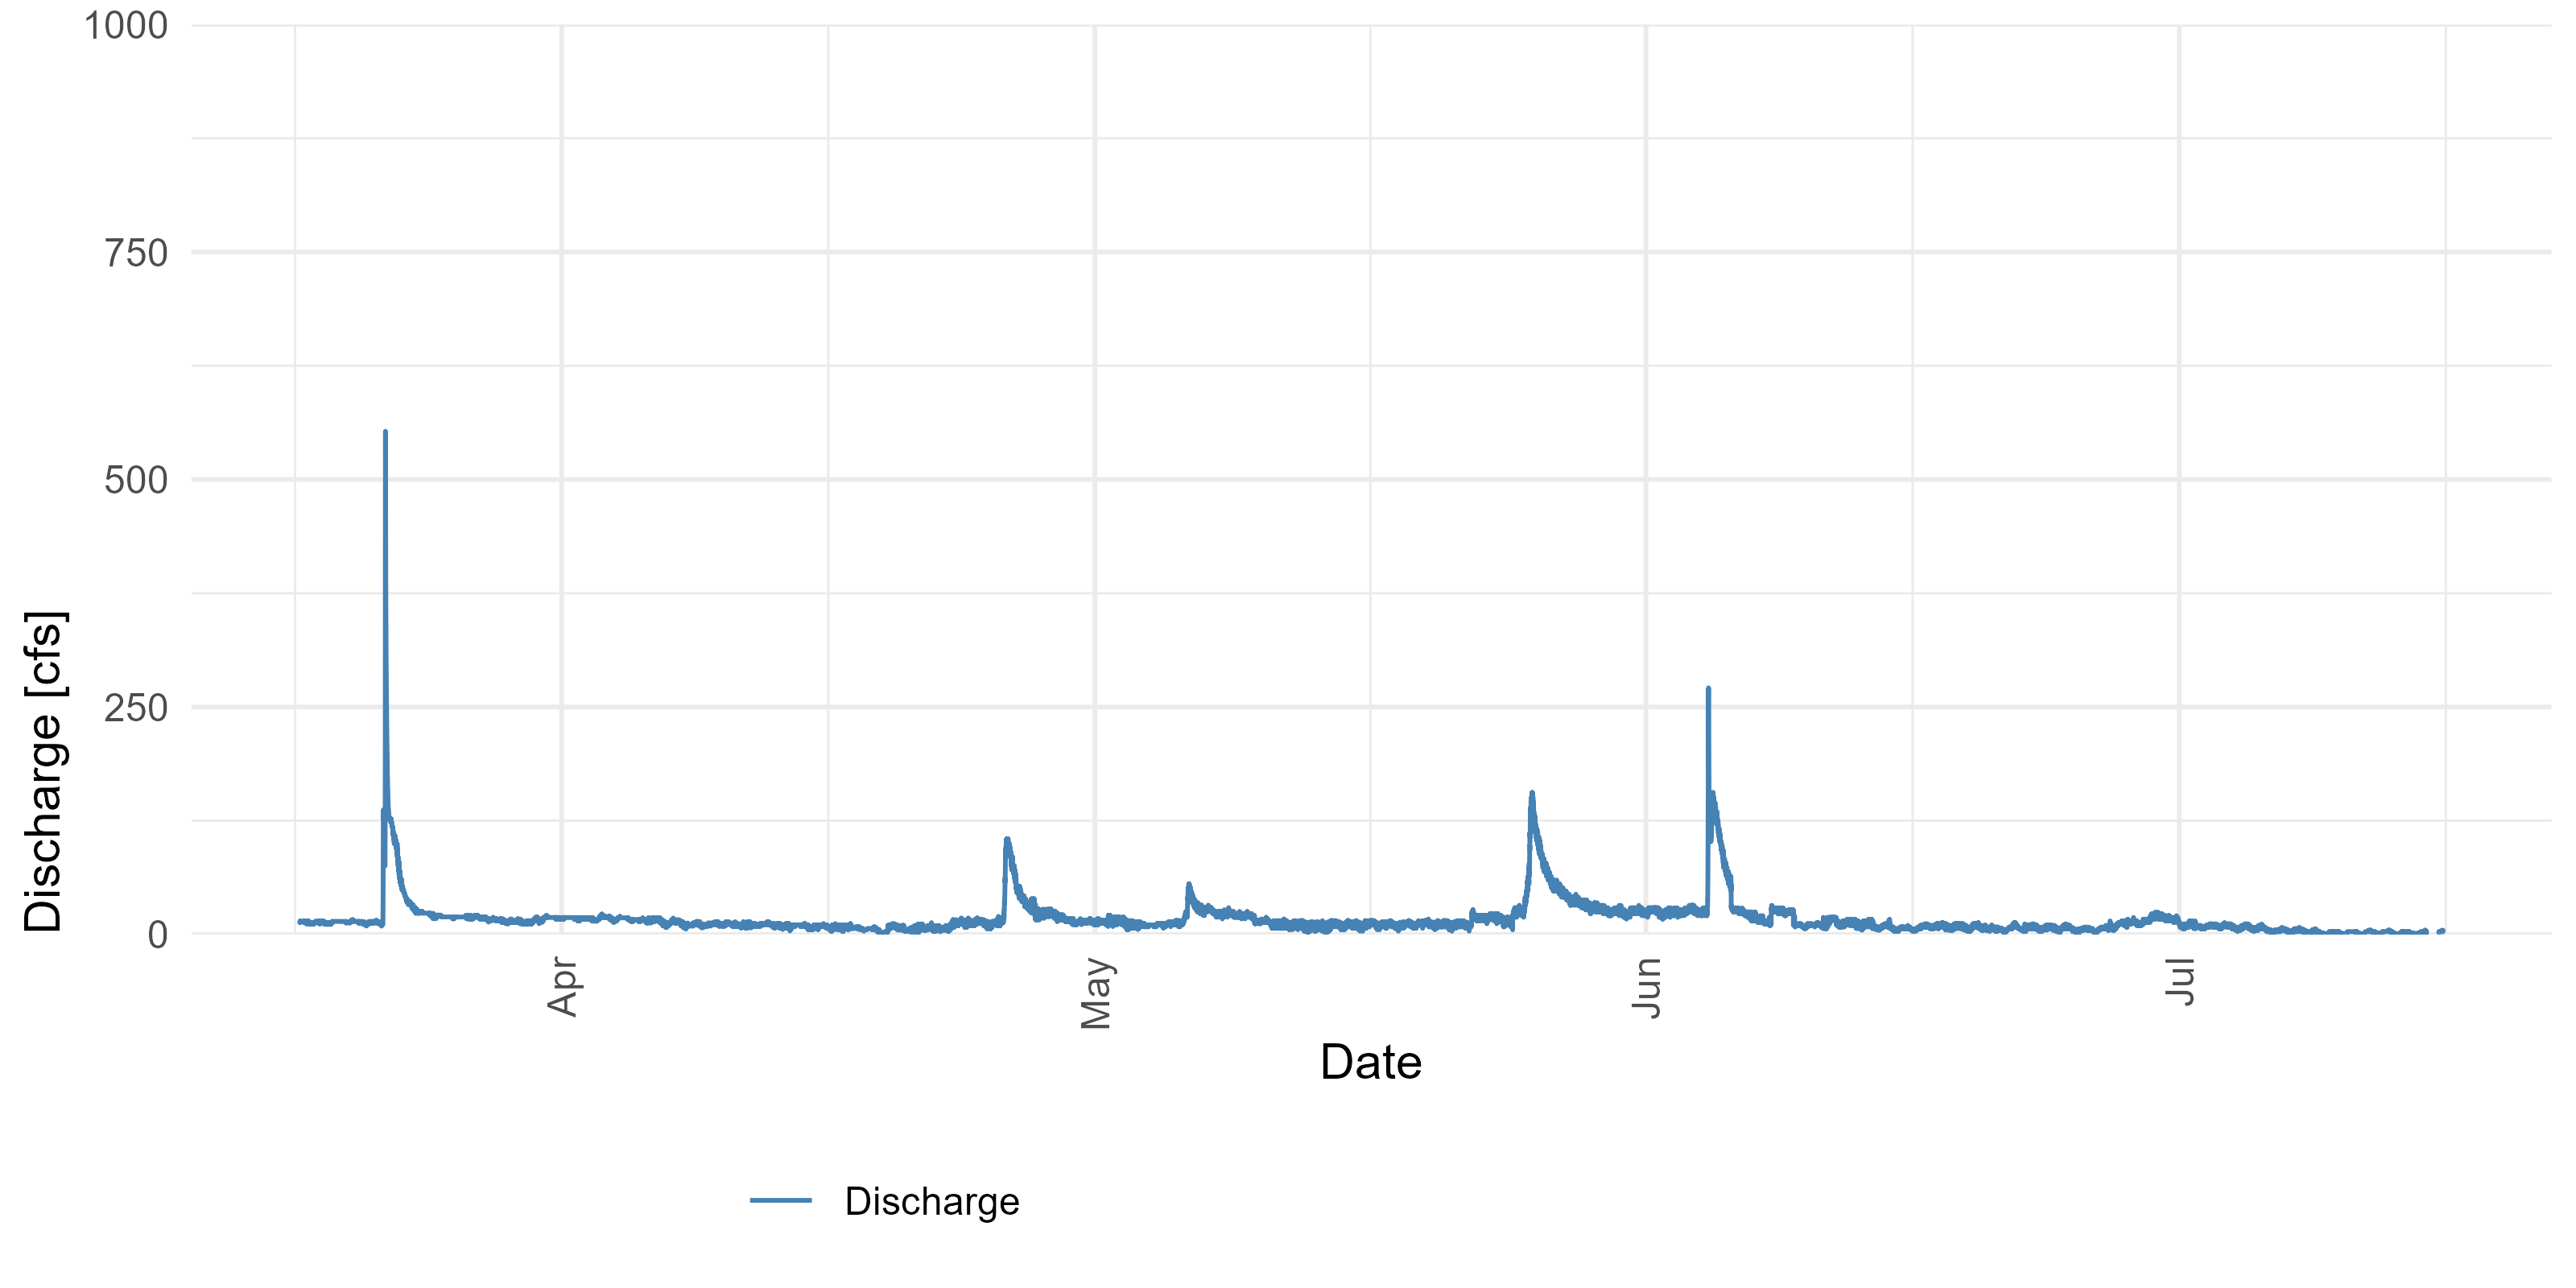
Combine a hydrograph and hyetograph in ggplot2
Streamflow hydrographs and precipitation hyetographs are commonly combined into one plot by hydrologists. Here is one way to make these plots in R.
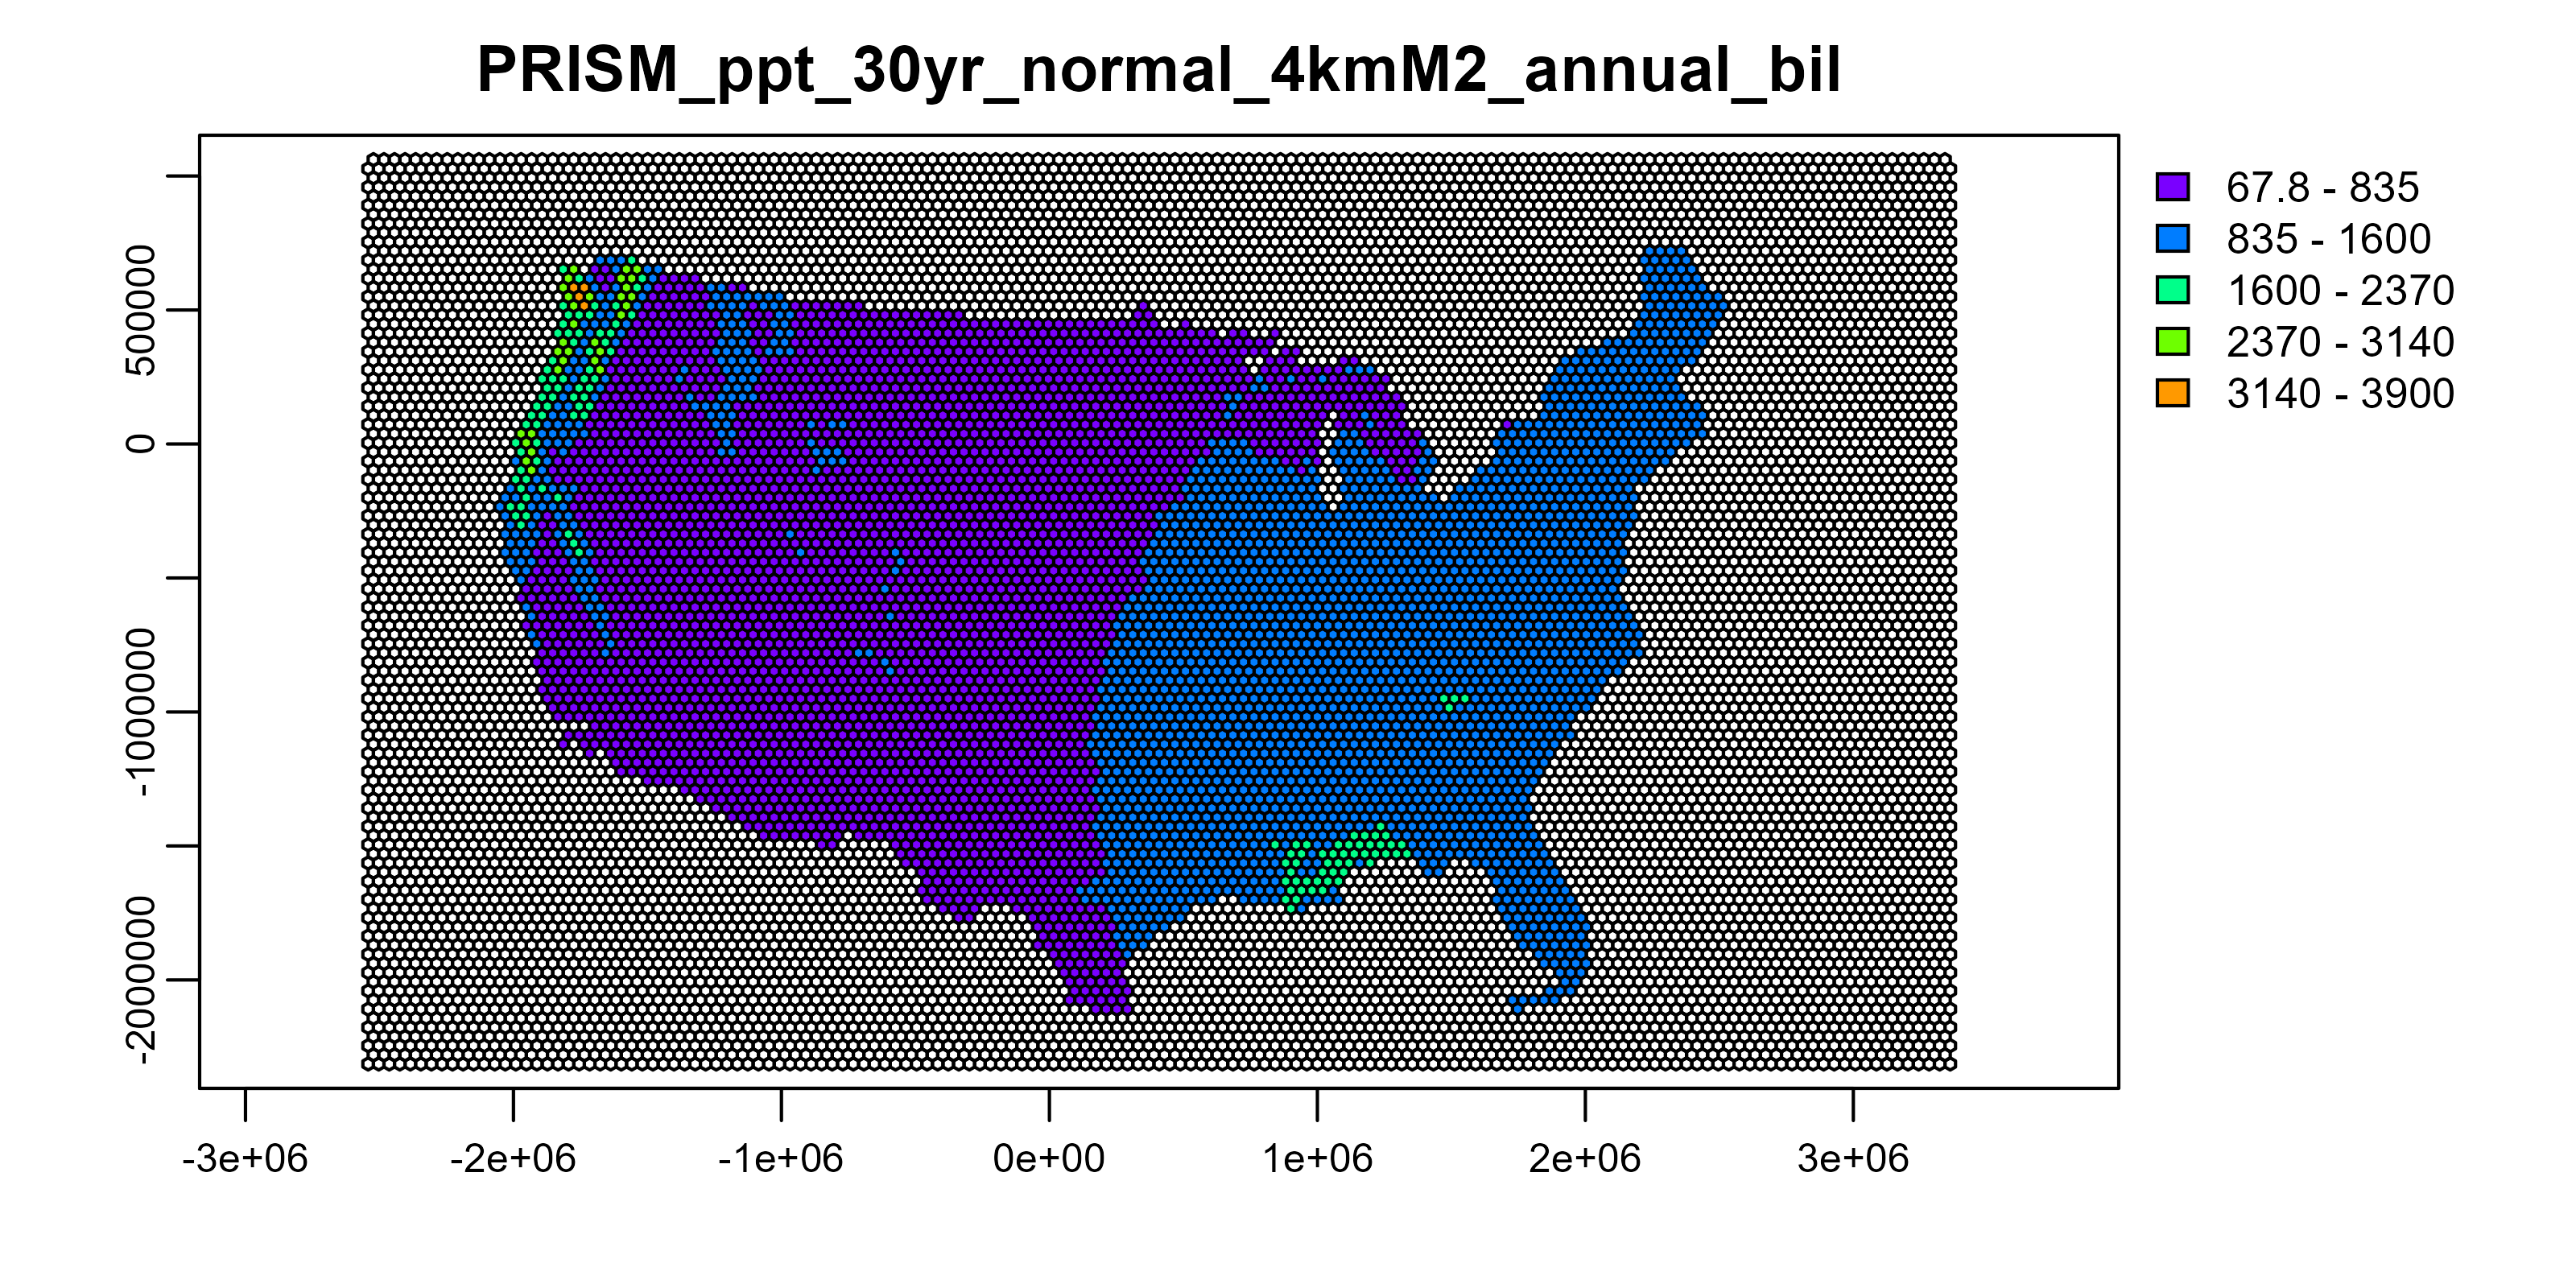
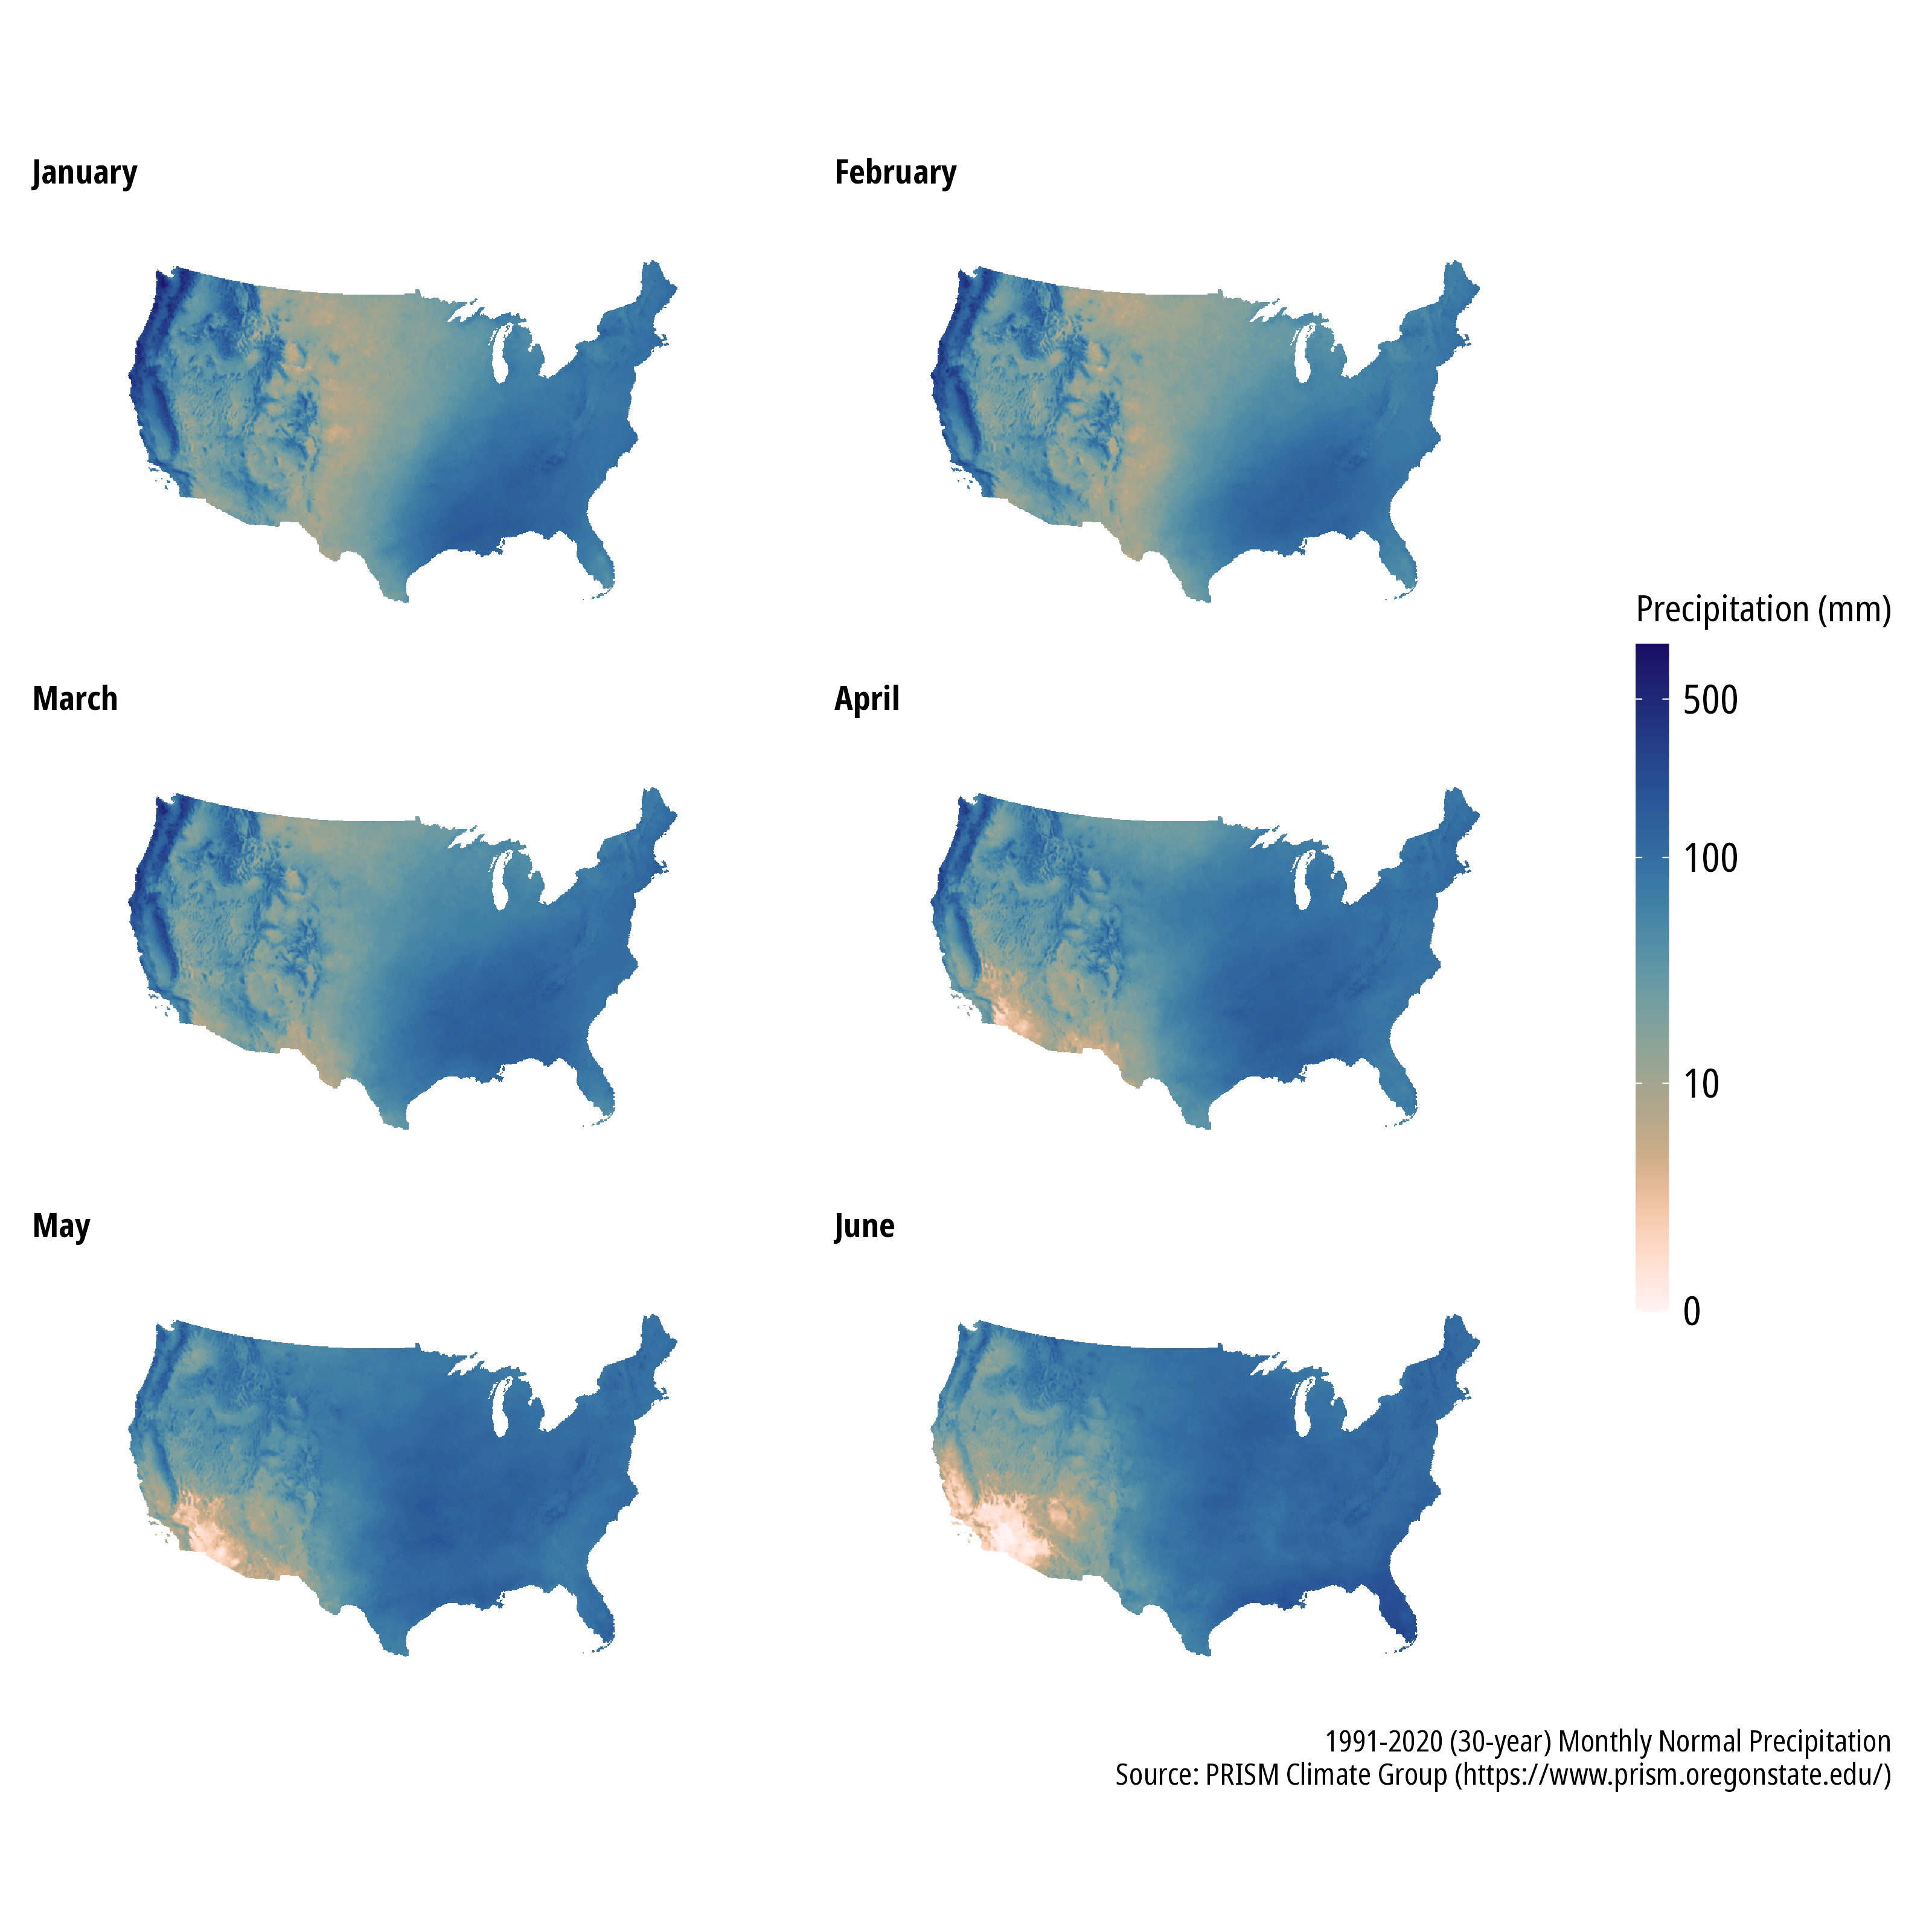
Rayshading Precipitation Maps
I rendered some preciptiation maps of the contiguous US with rayshader.
Rayshading maps
An adventure in using rayshader.
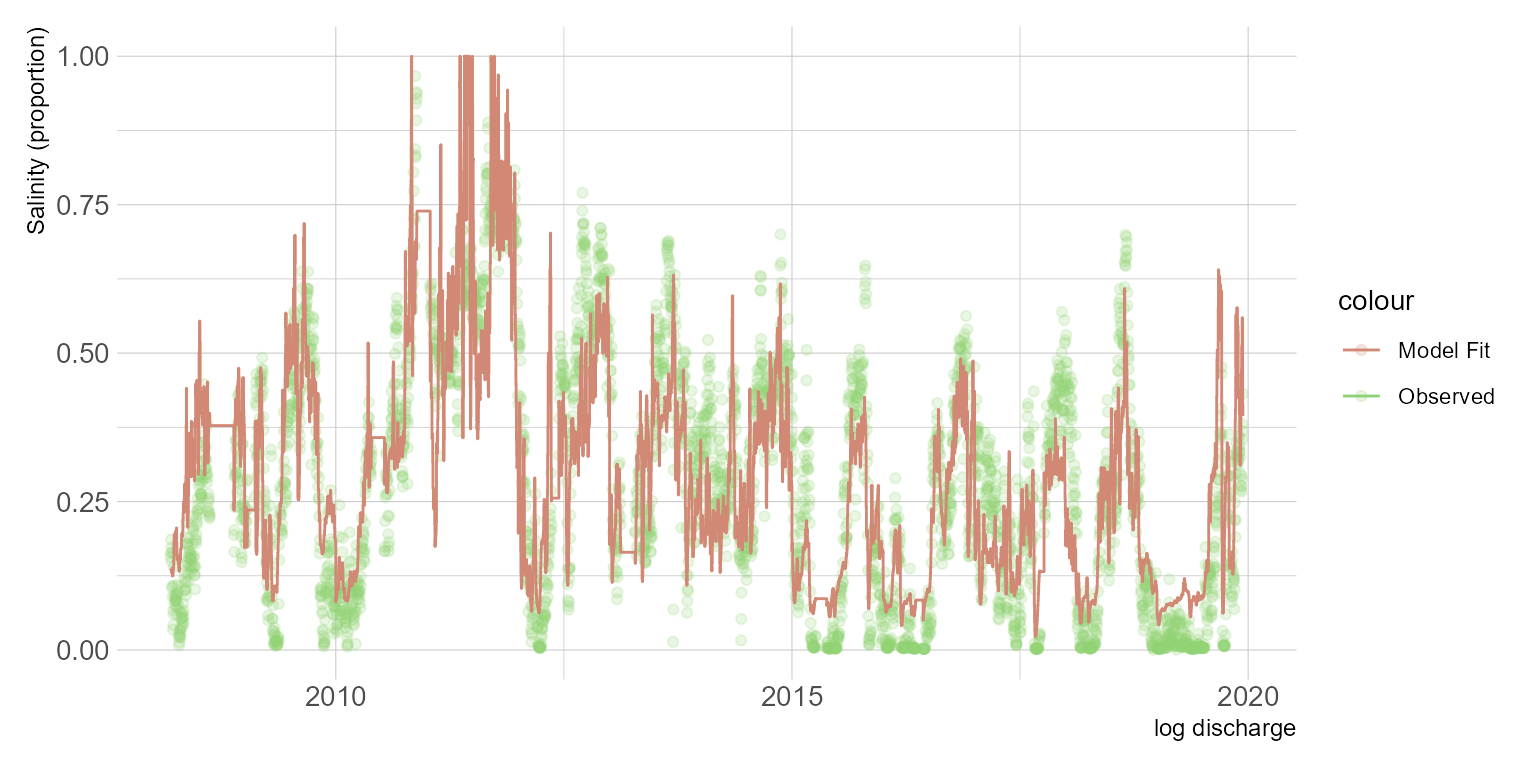
Predicting estuarine salinity using simple statistical models part 2
Part one of some statistical approaches for estimating estuarine salinity using freshwater inflow.
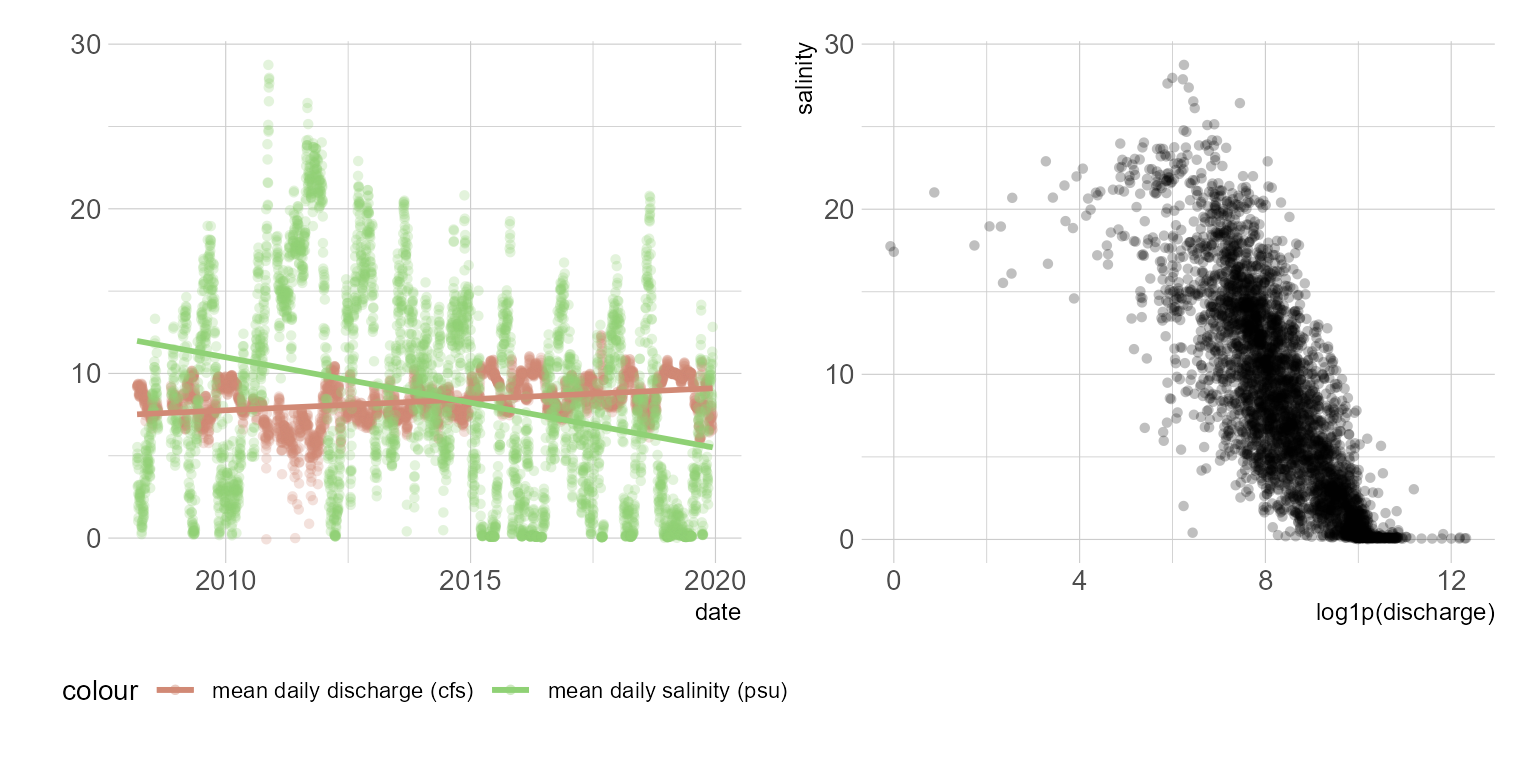
Predicting estuarine salinity using simple statistical models part 1
Part one of some statistical approaches for estimating estuarine salinity using freshwater inflow.
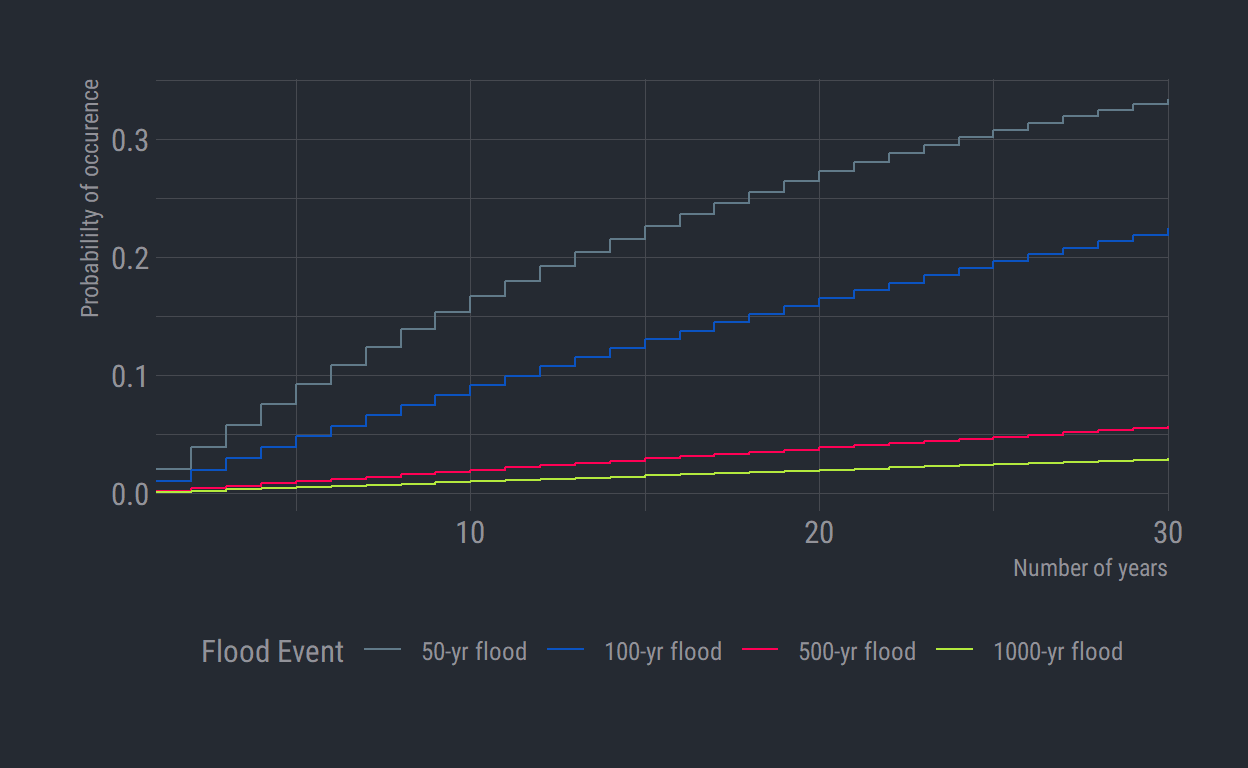
Plotting flood probability
Communicate flood probability in relatable terms.
Introducing echor
Download EPA data with R
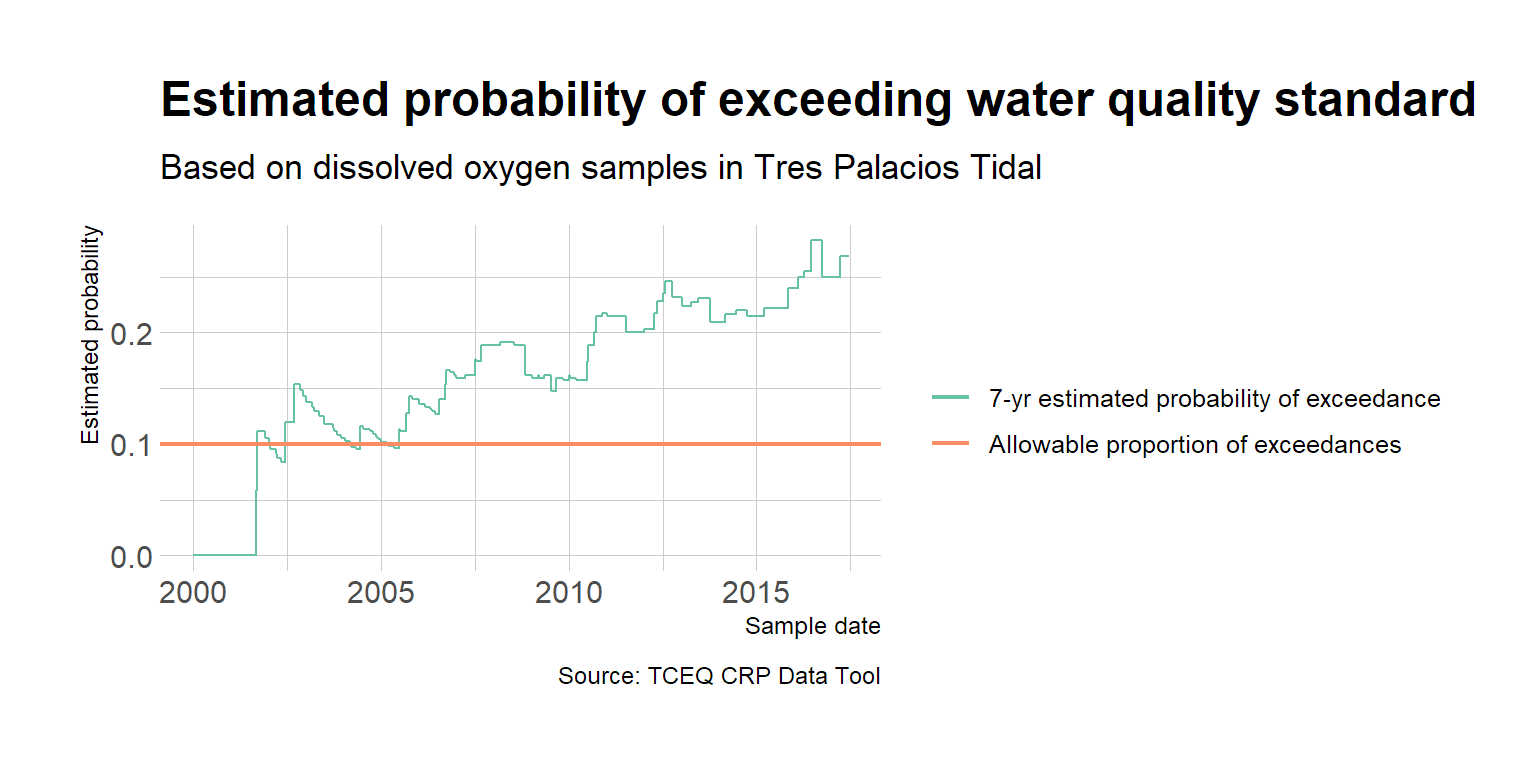
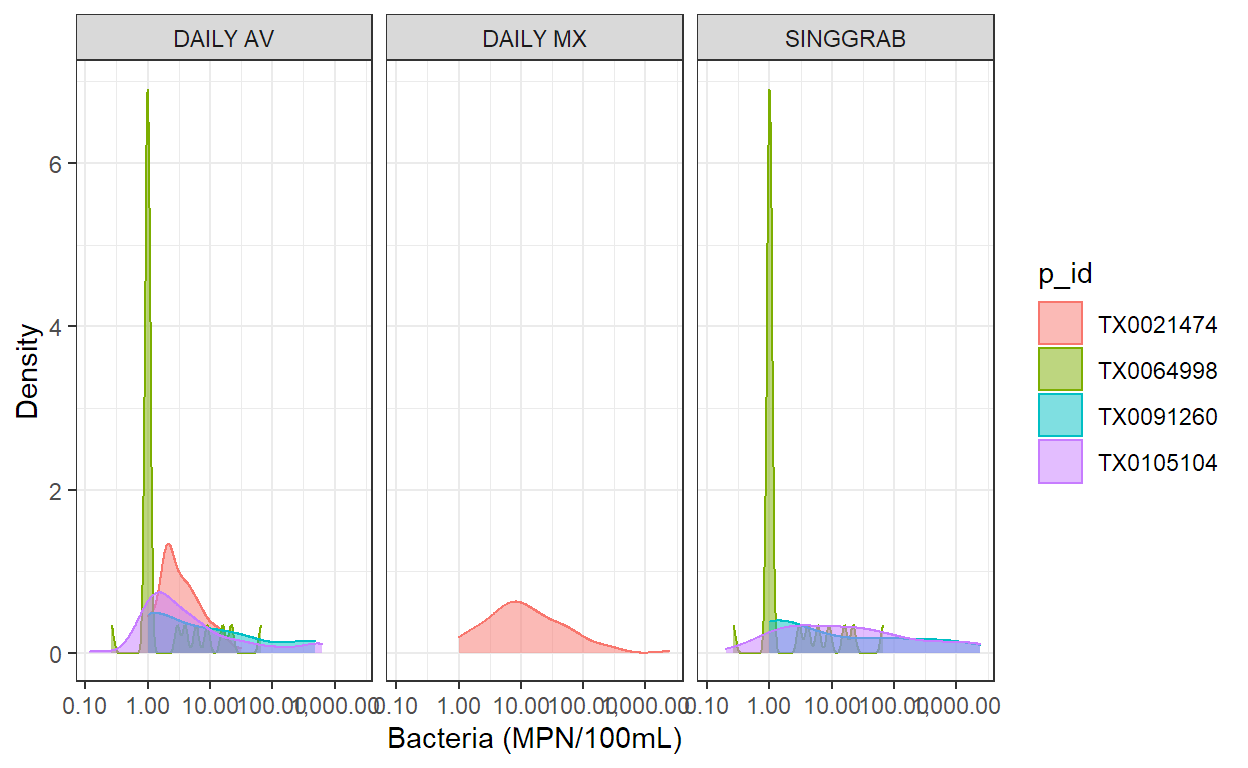
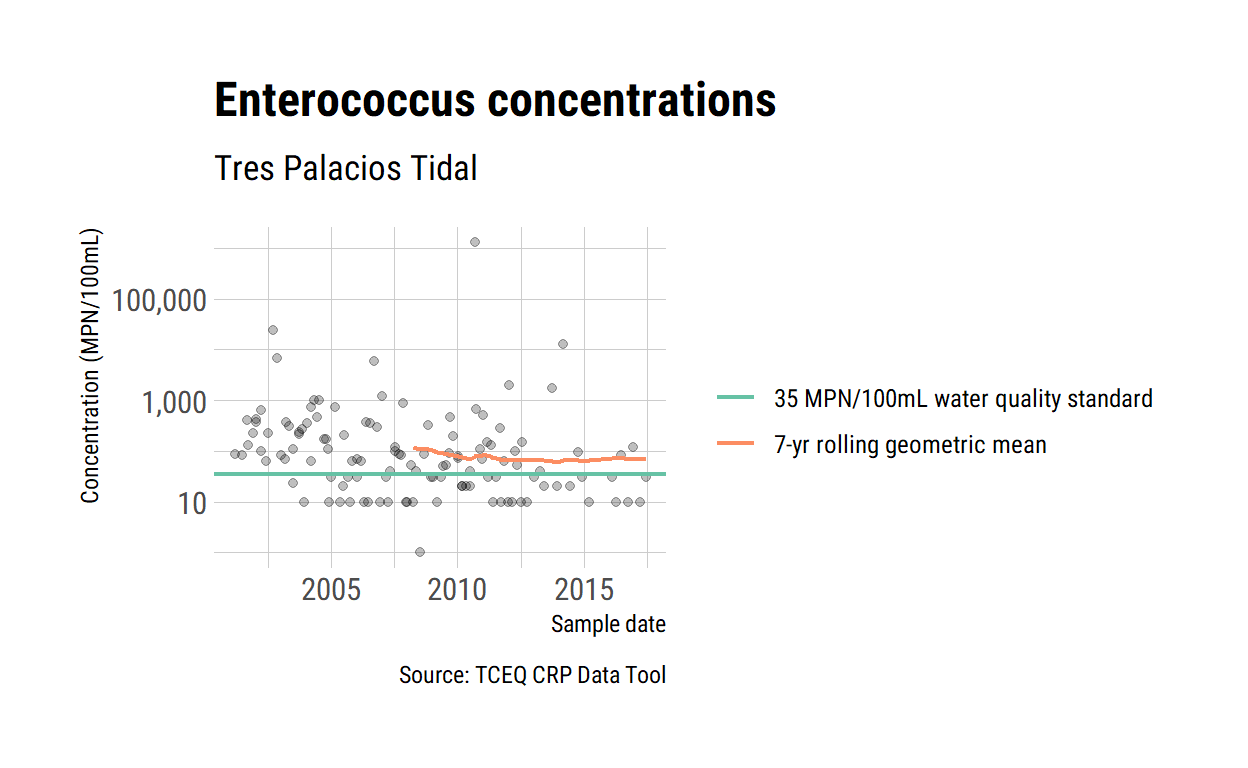
Binomial Test for Water Quality Compliance
Use the binomial test to evaluate water quality compliance.
Date-based rolling functions
Apply rolling statistics to non-routine time series data.
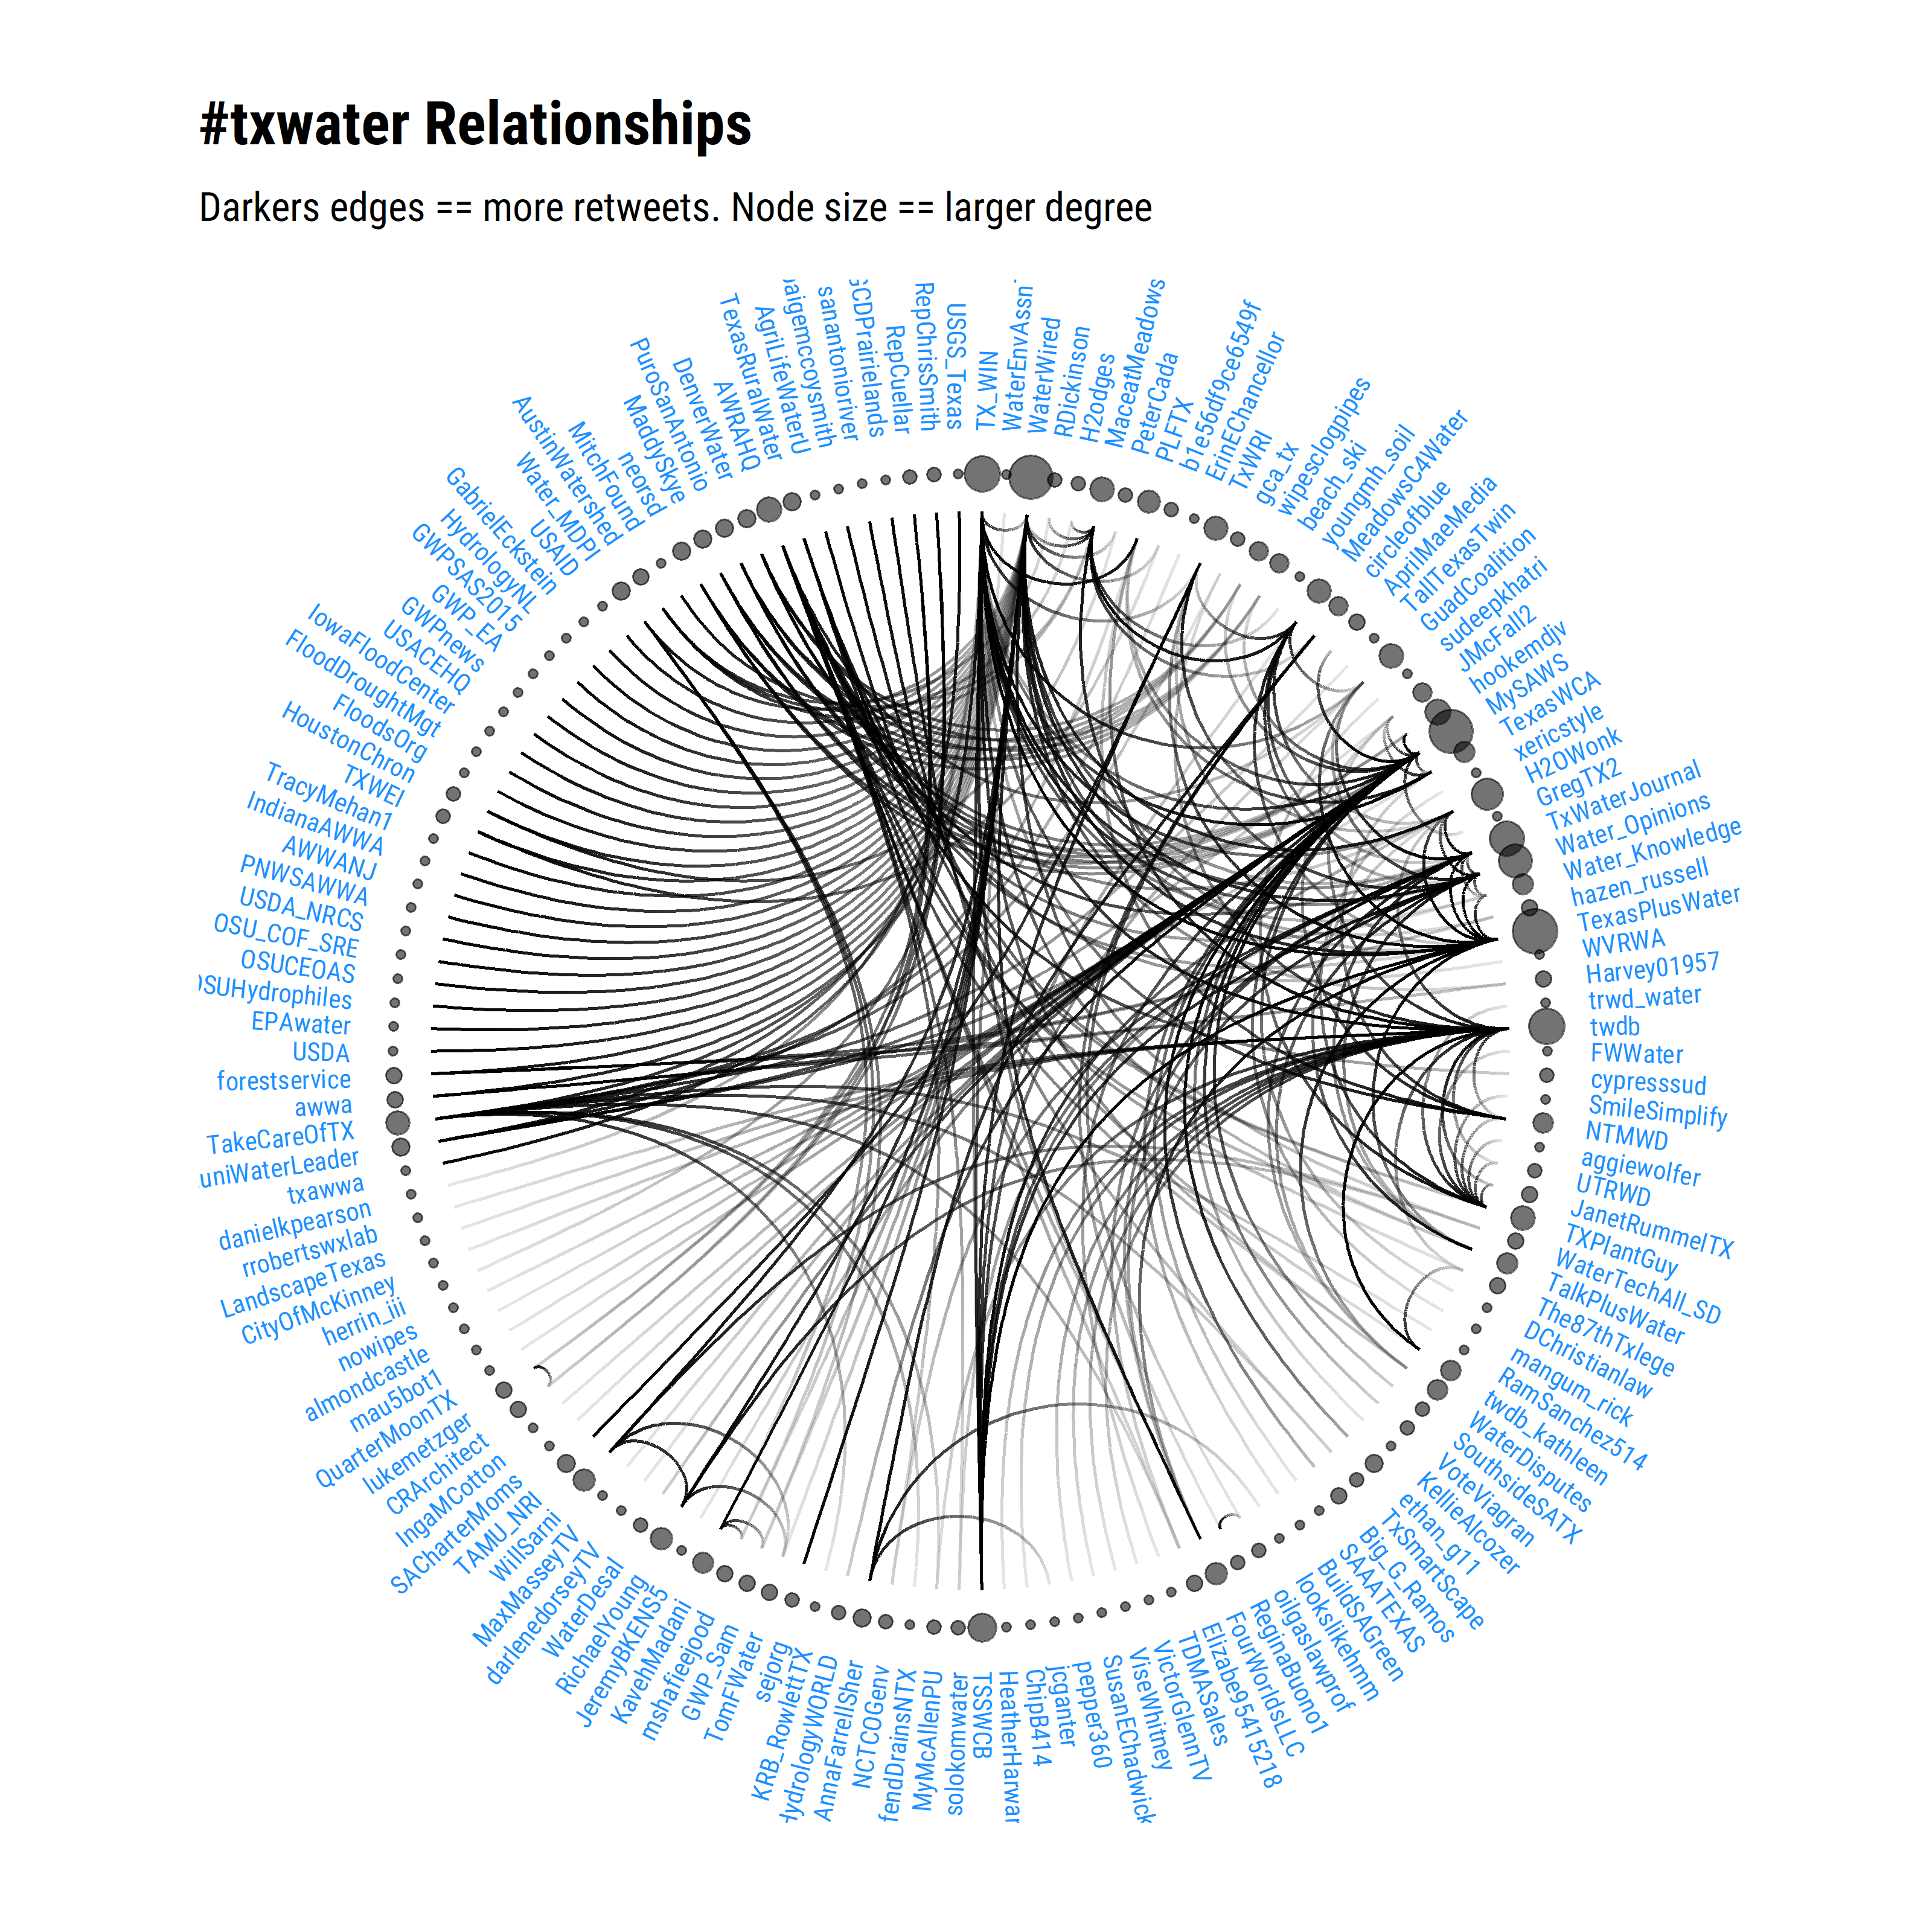
txwater retweets
Let's find out the retweet relationships for txwater twitter users.
Time-series decomposition and trend analysis in Python
Decompose time series in Python and a function for the Mann-Kendall test for trend.