States are responsible for water quality assessments that ensure waterbodies comply with designated uses under Section 305(b) of the Clean Water Act. Waterbodies that do not meet applicable standards are listed on the Section 303(d) list, which requires state establish a Total Maximum Daily Load (TMDL) for pollutants responsible for impairment.
For conventional parameters, the current guidance from EPA requires that a waterbody be listed when greater than 10% of samples exceed the numeric criteria. For bacteria parameters, a waterbody is listed when the geometric mean of samples exceeds the criteria. In the state of Texas, the Texas Comission on Environmental Quality (TCEQ) publishes its assessment guidance document (pdf warning) regarding listing and delisting decisions made for waterbodies. TCEQ publishes the results of their assessment every two years in the Texas Integrated Report of Surface Water Quality. Although published every two years, the data typically lags behind an additional two years. For example the 2014 report, which was released in late 2015, includes data collected through 2012. To provide an up to date snapshot, I am interested in providing a visualization of current water quality data and representation of the assessment.
For bacteria parameters, this seems fairly easy. Plotting a 7-yr rolling geometric mean depicts when assessment exceedances occur. However, most packages in R will calculate rolling averages or functions for regularly spaced data based on the number of observations. Water quality data is collected at random and unequal intervals. For any 7-yr period there might be 20 samples or 100 samples. All valid samples should be included in the function window.
Rolling geometric mean for bacteria assessment
My sample dataset is pipe delimited text file obtained from TCEQ’s CRP data tool. It includes Enterococcus bacteria concentrations measured in the Tres Palacios water body. Below is a code chunk I used to download, read, and filter the dataset to something usable.
library(readr)
library(dplyr)
library(ggplot2)
file <- url("https://gist.githubusercontent.com/mps9506/004624b5aa9bdf101c36278835cb38df/raw/46267d403bb450da4f7a0c726bd77d4fff1c5be5/1501_Bacteria.txt")
df <- read_delim(file, "|")
df <- df %>%
  select(`RFA(Sample Set ID)/Tag_id`, Segment, `Parameter Code`, Value, `End Date`, `Monitoring Type`) %>%
  mutate(`End Date` = as.Date(`End Date`, "%m/%d/%Y")) %>%
  filter(`Monitoring Type` == "RT")
## Take a quick peek at the data
ggplot(df) +
  geom_point(aes(`End Date`, Value)) +
  scale_y_log10() + ylab("MPN/100mL") + xlab("Sample Date")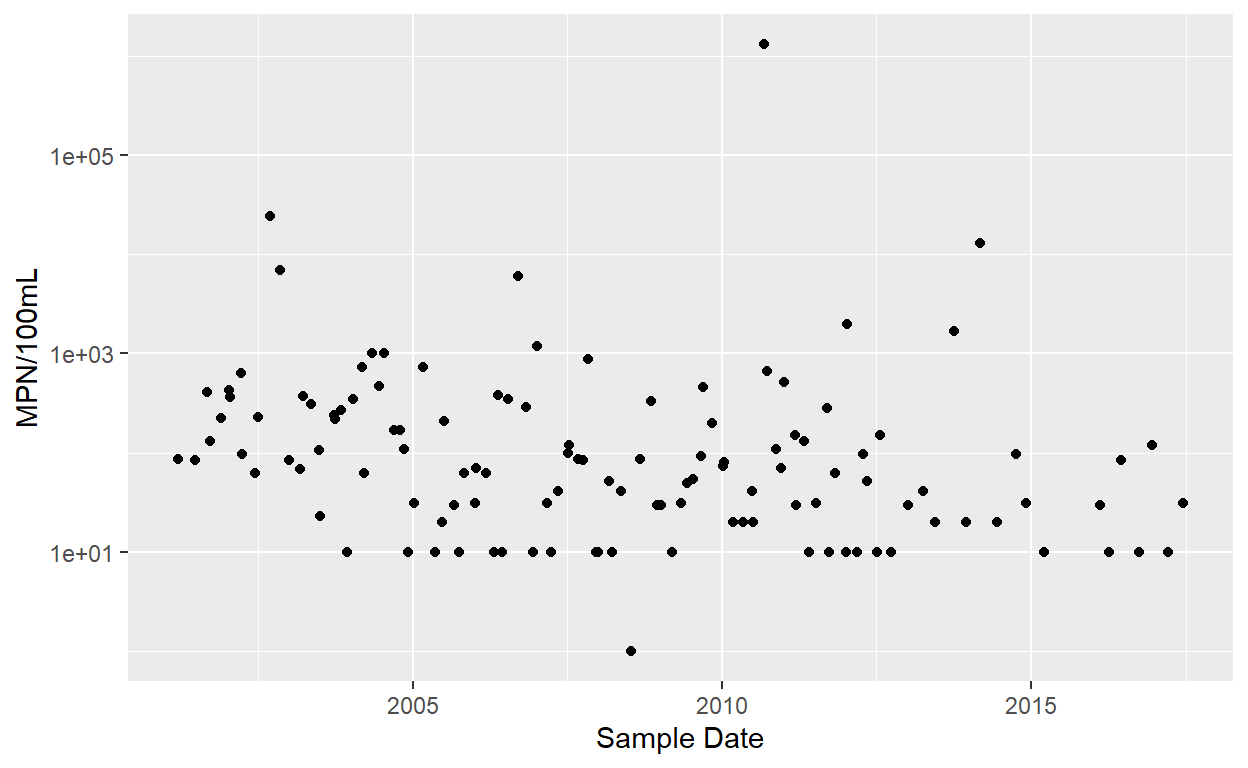
First thing that I notice is the number of censored values at 10 MPN/100mL. As far as I am aware, these are left alone for assessemnt purposes. I will revisit this in another post.
In order to calculate the geometric mean, we need to import a library or define a function since there is no geometric mean function defined in R.
gm_mean <- function(x, na.rm=TRUE, zero.propagate = FALSE){
  if(any(x < 0, na.rm = TRUE)){
    return(NaN)
  }
  if(zero.propagate){
    if(any(x == 0, na.rm = TRUE)){
      return(0)
    }
    exp(mean(log(x), na.rm = na.rm))
  } else {
    exp(sum(log(x[x > 0]), na.rm=na.rm) / length(x))
  }
}
I want to utilize purrr::map to apply this function so that it calculates the geometric mean of the last seven years of data from each row. So we need a function that will subtract the dates, identify rows within 7 years of the current row, and return a geometric mean of those rows. We can do this with a loop, but as I am trying to use these map functions provided in the purrr package as they provide a nice functional programming way of addressing this problem.
So the first step is to create a function that identifies the values within 7 years of the current row and returns the geomean of those values. I also do not need a value calculated for measurements within the first 7 years.
library(lubridate) ## import lubridate for as.duration and dyears functions
myfunc <- function(dates, values, years, i){
  mu <- values[as.duration(dates[i] - dates)/dyears(1) <= years & as.duration(dates[i] - dates)/dyears(1) >= 0]
  if(as.duration(dates[i] - dates[1])/dyears(1) < 7){
    return(NA)
  }
  else(gm_mean(mu)
  )
}
Now apply this function using map in the dplyr chain:
library(purrr)
df2 <- df %>%
  arrange(`End Date`) %>%
  mutate(Rolled_gm = map_dbl(seq_along(.$`End Date`),
                             ~myfunc(dates = `End Date`, values = `Value`, years = 7, i = .x)))
head(df2)
# A tibble: 6 x 7
  `RFA(Sample Set~ Segment `Parameter Code` Value `End Date`
  <chr>              <dbl>            <dbl> <dbl> <date>
1 R194284             1501            31701    86 2001-03-14
2 R195801             1501            31701    85 2001-06-21
3 L064180             1501            31701   410 2001-09-05
4 R198132             1501            31701   132 2001-09-18
5 L067079             1501            31701   221 2001-11-26
6 R200081             1501            31701   428 2002-01-10
# ... with 2 more variables: `Monitoring Type` <chr>, Rolled_gm <dbl>
Visualize this with ggplot:
library(hrbrthemes)
ggplot(df2) +
  geom_point(aes(`End Date`, Value), alpha = 0.25) +
  geom_line(aes(`End Date`, `Rolled_gm`, color = "7-yr rolling geometric mean"), size = .75) +
  geom_hline(aes(yintercept = 35, color = "35 MPN/100mL water quality standard"), size = .75) +
  scale_y_log10(labels = scales::comma) +
  theme_ipsum_rc() + scale_color_brewer(name = "", type = "qual", palette = "Set2") +
  labs(
    title = "Enterococcus concentrations",
    subtitle = "Tres Palacios Tidal",
    caption = "Source: TCEQ CRP Data Tool",
    x = "Sample date", y = "Concentration (MPN/100mL)"
  )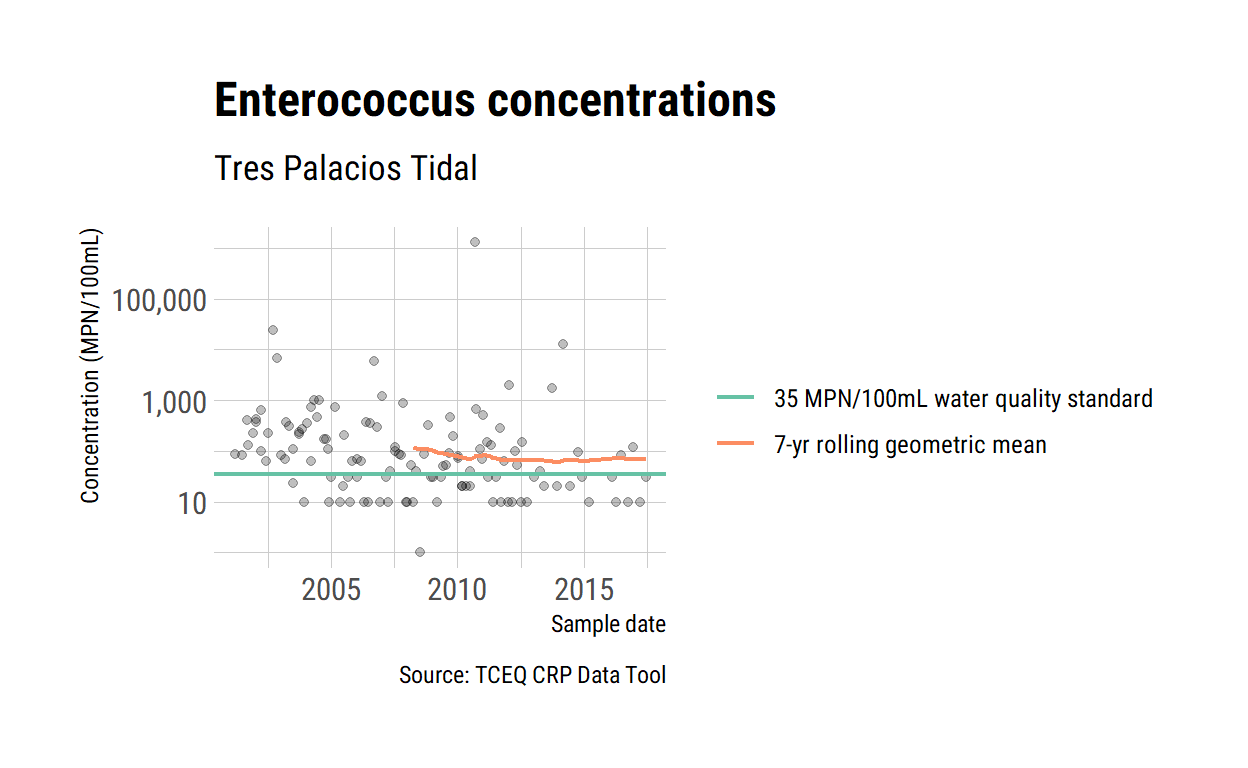
I think this a relatively easy figure for stakeholders to understand. The red line depicts the rolling geometric mean used to assess compliance with water quality standards at any given sampling point.