The public generally misunderstands the recurrence intervals used to describe flood events or storms. Typically, people believe the 100-year flood event as something that will only happen once every one hundred years. This is understandable given the description. However this recurrence interval means that there is a 1% chance of the event occurring in any given year. It might be better to explain the probability of a given flood event occurring over a time period. Say, 5 years or maybe over a 15 or 30 year mortgage. Then a person that moves into a 100-year floodplain would have some understanding of the probability of experiencing a flood event over the next n-years. We can use a binomial formula to calculate and graphically display these probabilities:
\[ P(k \text{ exceedances } n \text{ years})=\frac{n!}{k!(n-k)!}p^k(1-p)^{n-k} \]
The relationship between probability \(p\) and the recurrence interval \(RI\), \(RI=\frac{1}{p}\). In R we can utilize dbinom() to calculate the exceedance probability as: dbinom(k, n, p).
library(dplyr)
library(ggplot2)
library(hrbrthemes)
df <- tibble(ri = rep(c(50, 100, 500, 1000), each = 30), # return interval
n = rep(1:30, 4), # n years
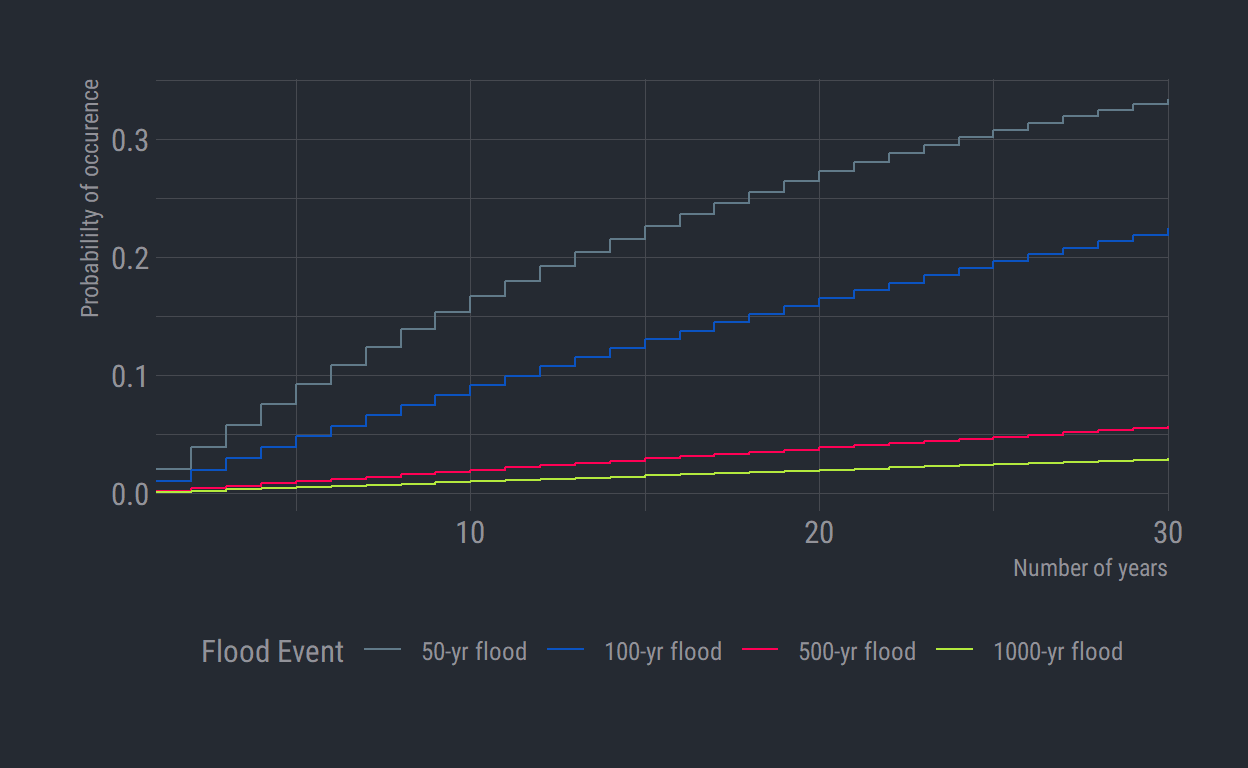
aep = dbinom(1, n, 1/ri)) # exceedance probabilityNow plot the probability of a flood event happening over n-years:
ggplot(df) +
  geom_step(aes(n, aep, color = as.factor(ri))) +
  labs(x = "Number of years",
       y = "Probabililty of occurence") +
  scale_color_ft(name = "Flood Event", labels = c("50-yr flood",
                                                  "100-yr flood",
                                                  "500-yr flood",
                                                  "1000-yr flood")) +
  scale_x_continuous(expand = c(0, 0)) +
  theme_ft_rc() +
  theme(legend.position = "bottom",
        axis.title.y.right = element_blank())