The U.S. Environmental Protection Agency (EPA) provides access to facility and compliance information for registered permit holders under the Clean Air Act, Clean Water Act. The primary way for non-governmental entities to obtain this data is through the EPA Environmental and Compliance History Online (ECHO) website. Data is housed under “media-specific” programs. Relevant to this post, the National Pollutant Discharge Elimination Systems (NPDES) maintains data on pollutant discharges to waterways and the Air Facility Service (AFS) maintain data on emission to air. Gibbs (Gibbs and Simpson 2009) assess the strengths and weakness of the data collated by ECHO and provide an example of assessing environmental crime rates. While a discussion about the merits of EPA’s environmental data collection efforts and methodology are warranted, this post will discuss a new package that provides API access to the ECHO database.
Introduction and need
I primarily use ECHO to obtain discharge monitoring records for wastewater and industrial discharges. Until recently, my workflow was to call or email the state environmental agency and ask for all the available permit numbers in the watershed. Some states maintain and provide a GIS file with spatial locations (this was preferred, but finding out when that file was last updated was can be difficult). Once I obtained the permit numbers, I log onto ECHO and type the permits numbers in, and individually retrieve discharge records for each facility. This requires quite a bit of clicking and typing, and is prone to error. Furthermore, there is no way to verify the records I received are correct. If I mistyped a number or received a wrong record from the agency, I have little way of catching the error.
Thankfully, ECHO provides web access through “GET” and REST services to provide some level of automated and reproducible data access. I recently wrote the echor package to provide access to these service in R. This was my first attempt at developing an R package and my first attempt at utilizing data APIs in a programatic way.
echor provides functions to search for and obtain facility data under the NPDES, AFS, and Safe Drinking Water (SDW) program areas. Functions are also available to retrieve facility specific pollutant discharge data under the NPDES and AFS programs. Under the NPDES program, pollutant discharge reporting intervals are specific to the permit, so you may get records on quarterly, monthly, or perhaps daily basis. Records under the AFS program are returned as annual emissions.
Use cases
Download facility specific discharge records
If you have a facility permit number, downloading the discharge records is pretty simple. I made every attempt to return records in “tidy” long format to make plotting and further analysis easy. If you haven’t already, install echor from CRAN.
install.packages("echor")
echoGetEffluent() will return the facility reported discharges. Arguments are available to specify the permit number, date range, and parameter code (the pollutant of interest). A function is also provided to search for parameter codes: echoWaterGetParams(). In the following example I want to identify the parameter code for daily flow, then get the reported discharge for a facility that I already have a permit number for.
## Load package
library(echor)
## Find the parameter code
echoWaterGetParams(term = "Flow, in conduit")
# A tibble: 2 x 2
  ValueCode ValueDescription
  <chr>     <chr>
1 51725     Flow, in conduit or thru treatment plant
2 50050     Flow, in conduit or thru treatment plant
Here, I get two parameter codes. I happen to know I want to use parameter code 50050. Searching for the right terminology and correct code can be difficult and might require some trial and error.
The next step is to obtain the discharge records:
df <- echoGetEffluent(p_id = 'tx0119407', parameter_code = '50050',
                      start_date = "01/01/2017", end_date = "08/30/2018")
tibble::glimpse(df)
Rows: 38
Columns: 61
$ activity_id                 <chr> "3600178396", "3600178396", "360~
$ npdes_id                    <chr> "TX0119407", "TX0119407", "TX011~
$ version_nmbr                <chr> "4", "4", "4", "4", "4", "4", "4~
$ perm_feature_id             <chr> "3600049681", "3600049681", "360~
$ perm_feature_nmbr           <chr> "001", "001", "001", "001", "001~
$ perm_feature_type_code      <chr> "EXO", "EXO", "EXO", "EXO", "EXO~
$ perm_feature_type_desc      <chr> "External Outfall", "External Ou~
$ limit_set_id                <chr> "3600061722", "3600061722", "360~
$ limit_set_schedule_id       <chr> "3600073706", "3600073706", "360~
$ limit_id                    <chr> "3600437316", "3600437316", "360~
$ limit_type_code             <chr> "ENF", "ENF", "ENF", "ENF", "ENF~
$ limit_begin_date            <chr> "08/01/2015", "08/01/2015", "08/~
$ limit_end_date              <chr> "03/01/2020", "03/01/2020", "03/~
$ nmbr_of_submission          <chr> "1", "1", "1", "1", "1", "1", "1~
$ parameter_code              <chr> "50050", "50050", "50050", "5005~
$ parameter_desc              <chr> "Flow, in conduit or thru treatm~
$ monitoring_location_code    <chr> "1", "1", "1", "1", "1", "1", "1~
$ monitoring_location_desc    <chr> "Effluent Gross", "Effluent Gros~
$ stay_type_code              <chr> "", "", "", "", "", "", "", "", ~
$ stay_type_desc              <chr> "", "", "", "", "", "", "", "", ~
$ limit_value_id              <chr> "3600678122", "3600678123", "360~
$ limit_value_type_code       <chr> "Q2", "Q1", "Q2", "Q1", "Q2", "Q~
$ limit_value_type_desc       <chr> "Quantity2", "Quantity1", "Quant~
$ limit_value_nmbr            <chr> "", ".131", "", ".131", "", ".13~
$ limit_unit_code             <chr> "03", "03", "03", "03", "03", "0~
$ limit_unit_desc             <chr> "MGD", "MGD", "MGD", "MGD", "MGD~
$ standard_unit_code          <chr> "03", "03", "03", "03", "03", "0~
$ standard_unit_desc          <chr> "MGD", "MGD", "MGD", "MGD", "MGD~
$ limit_value_standard_units  <chr> "", ".131", "", ".131", "", ".13~
$ statistical_base_code       <chr> "DD", "DB", "DD", "DB", "DD", "D~
$ statistical_base_short_desc <chr> "DAILY MX", "DAILY AV", "DAILY M~
$ statistical_base_type_code  <chr> "MAX", "AVG", "MAX", "AVG", "MAX~
$ statistical_base_type_desc  <chr> "Maximum", "Average", "Maximum",~
$ limit_value_qualifier_code  <chr> "", "<=", "", "<=", "", "<=", "<~
$ stay_value_nmbr             <chr> "", "", "", "", "", "", "", "", ~
$ dmr_event_id                <chr> "3600838828", "3600838828", "360~
$ monitoring_period_end_date  <chr> "01/31/2017", "01/31/2017", "02/~
$ dmr_form_value_id           <chr> "3610877673", "3610877668", "361~
$ value_type_code             <chr> "Q2", "Q1", "Q2", "Q1", "Q2", "Q~
$ value_type_desc             <chr> "Quantity2", "Quantity1", "Quant~
$ dmr_value_id                <chr> "3634771542", "3634771541", "363~
$ dmr_value_nmbr              <chr> ".0878", ".0603", ".0709", ".053~
$ dmr_unit_code               <chr> "03", "03", "03", "03", "03", "0~
$ dmr_unit_desc               <chr> "MGD", "MGD", "MGD", "MGD", "MGD~
$ dmr_value_standard_units    <chr> ".0878", ".0603", ".0709", ".053~
$ dmr_value_qualifier_code    <chr> "=", "=", "=", "=", "=", "=", "=~
$ value_received_date         <chr> "02/16/2017", "02/16/2017", "03/~
$ days_late                   <chr> "", "", "", "", "", "", "", "", ~
$ nodi_code                   <chr> "", "", "", "", "", "", "", "", ~
$ nodi_desc                   <chr> "", "", "", "", "", "", "", "", ~
$ exceedence_pct              <chr> "", "", "", "", "", "", "", "", ~
$ npdes_violation_id          <chr> "", "", "", "", "", "", "", "", ~
$ violation_code              <chr> "", "", "", "", "", "", "", "", ~
$ violation_desc              <chr> "", "", "", "", "", "", "", "", ~
$ rnc_detection_code          <chr> "", "", "", "", "", "", "", "", ~
$ rnc_detection_desc          <chr> "", "", "", "", "", "", "", "", ~
$ rnc_detection_date          <chr> "", "", "", "", "", "", "", "", ~
$ rnc_resolution_code         <chr> "", "", "", "", "", "", "", "", ~
$ rnc_resolution_desc         <chr> "", "", "", "", "", "", "", "", ~
$ rnc_resolution_date         <chr> "", "", "", "", "", "", "", "", ~
$ violation_severity          <chr> "No Violation Identified", "No V~
The returned data_frame includes a row for each reporting period from the facility and a row for each statistical type (daily average and daily max in this case). Please note, that if you include the available start_date and end_date arguments in the function, they must be entered as "mm/dd/yyyy".
Use dplyr to do some data tidying and ggplot2 to make a quick plot of this data:
library(dplyr)
library(ggplot2)
df <- df %>%
mutate(monitoring_period_end_date = as.Date(monitoring_period_end_date, "%m/%d/%Y"),
dmr_value_nmbr = as.numeric(dmr_value_nmbr))
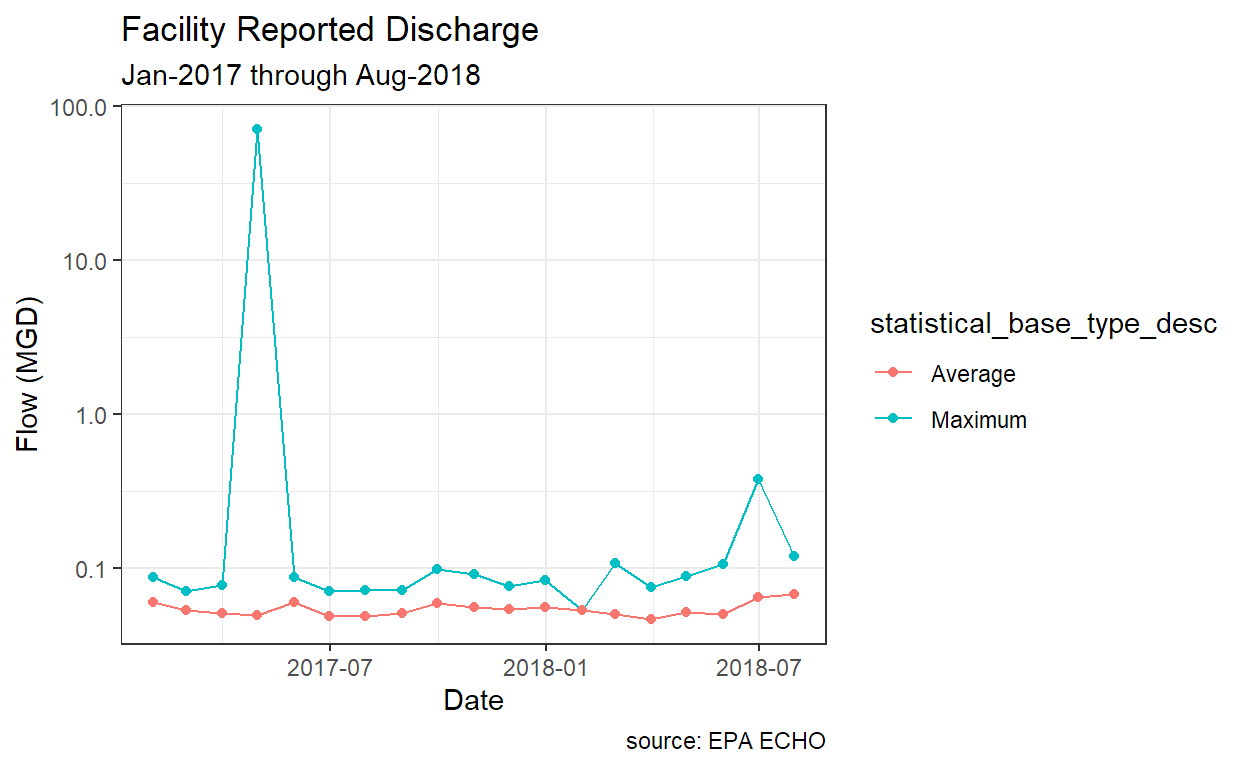
ggplot(df) +
geom_line(aes(monitoring_period_end_date, dmr_value_nmbr, color = statistical_base_type_desc)) +
geom_point(aes(monitoring_period_end_date, dmr_value_nmbr, color = statistical_base_type_desc)) +
scale_y_log10() +
labs(x = "Date", y = "Flow (MGD)",
title = "Facility Reported Discharge",
subtitle = "Jan-2017 through Aug-2018",
caption = "source: EPA ECHO") +
theme_bw()
Find facilities and data
Searching ECHO for for permit holders by location or facility characterisitics is really valuable, albeit potentially verbose. The functions available for facility search have a long list of available search arguments. Here I will demonstrate a search by hydrologic unit code, a useful search area for those in hydrology.
df <- echoWaterGetFacilityInfo(p_huc = "12100401")
tibble::glimpse(df)
Rows: 109
Columns: 26
$ CWPName                  <chr> "3280 FARM", "AES DRILLING FLUIDS E~
$ SourceID                 <chr> "TXG130056", "TXR05CX83", "TXR1597D~
$ CWPStreet                <chr> "1297 FM 3280", "27088 US 59 RD", "~
$ CWPCity                  <chr> "PALACIOS", "EL CAMPO", "EL CAMPO",~
$ CWPState                 <chr> "TX", "TX", "TX", "TX", "TX", "TX",~
$ CWPStateDistrict         <chr> "14", "", "", "12", "14", "14", "12~
$ CWPZip                   <chr> "774651779", "77437-9753", "77437",~
$ MasterExternalPermitNmbr <chr> "TXG130000", "TXR050000", "TXR15000~
$ RegistryID               <chr> "110045502639", "110070367509", "11~
$ CWPCounty                <chr> "Jackson", "", "", "Matagorda", "Ca~
$ CWPEPARegion             <chr> "06", "06", "06", "06", "06", "06",~
$ FacDerivedHuc            <chr> "12100401", "12100401", "12100401",~
$ FacLat                   <dbl> 28.69808, 29.17455, 29.07067, 28.72~
$ FacLong                  <dbl> -96.32411, -96.29908, -96.27350, -9~
$ CWPTotalDesignFlowNmbr   <dbl> NA, NA, NA, NA, 92.320, NA, NA, NA,~
$ CWPActualAverageFlowNmbr <dbl> NA, NA, NA, NA, 92.320, NA, NA, NA,~
$ ReceivingMs4Name         <chr> "", "", "", "", "", "", "", "", "",~
$ AssociatedPollutant      <chr> "", "", "", "", "", "", "", "", "",~
$ MsgpPermitType           <chr> "", "", "", "", "", "", "", "", "",~
$ CWPPermitStatusDesc      <chr> "Terminated", "Admin Continued", "E~
$ CWPPermitTypeDesc        <chr> "General Permit Covered Facility", ~
$ CWPIssueDate             <date> 2012-03-13, 2016-10-25, 2020-10-05~
$ CWPEffectiveDate         <date> 2012-04-01, 2016-11-01, 2020-11-01~
$ CWPExpirationDate        <date> 2016-04-17, 2021-08-13, 2023-03-04~
$ CWPSNCStatusDate         <date> 2021-03-31, 2021-03-31, 2021-03-31~
$ LastDMRValueRcvdDate     <date> 2014-12-10, NA, NA, 2021-07-01, 20~
I found 47 permits, some are terminated some active. By default, the facility search function return a data_frame with variables I deemed useful. However, ECHO provides a a whole host of possible variables (in my state, these are often unfortunately left blank). echoWaterGetParams() will return a dataframe with these variable names, description and ColumnID number. Use the qcolumn argument in the search function to specify what variables you would like returned. According to echoWaterGetParams() there are 299 possible return variables. Certain variables are always returned regardless of the qcolumns argument specified. If I want to find all the POTW (public wastewater treatment plants), I need to specify qcolumn 27, which I cfound using the echoWaterGetMeta() function.
meta <- echoWaterGetMeta()
tibble::glimpse(meta)
Rows: 252
Columns: 6
$ ColumnName  <chr> "CWP_NAME", "SOURCE_ID", "CWP_STREET", "CWP_CITY~
$ DataType    <chr> "VARCHAR2", "VARCHAR2", "VARCHAR2", "VARCHAR2", ~
$ DataLength  <chr> "200", "30", "200", "100", "2", "5", "10", "9", ~
$ ColumnID    <chr> "1", "2", "3", "4", "5", "6", "7", "8", "9", "10~
$ ObjectName  <chr> "CWPName", "SourceID", "CWPStreet", "CWPCity", "~
$ Description <chr> "Facility or permit holder name, as maintained i~
df <- echoWaterGetFacilityInfo(p_huc = "12100401", qcolumns = "1,2,14,23,24,27")
df
# A tibble: 109 x 6
   CWPName      SourceID FacDerivedHuc FacLat FacLong CWPFacilityType~
   <chr>        <chr>    <chr>          <dbl>   <dbl> <chr>
 1 3280 FARM    TXG1300~ 12100401        28.7   -96.3 NON-POTW
 2 AES DRILLIN~ TXR05CX~ 12100401        29.2   -96.3 NON-POTW
 3 AKTINA SOLAR TXR1597~ 12100401        29.1   -96.3 NON-POTW
 4 ALAMO CONCR~ TXG1100~ 12100401        28.7   -96.2 NON-POTW
 5 ALCOA POINT~ TX00047~ 12100401        28.7   -96.6 NON-POTW
 6 APEKS AQUAC~ TXG1300~ 12100401        28.7   -96.4 NON-POTW
 7 BLESSING     TXG1300~ 12100401        28.9   -96.3 NON-POTW
 8 BLESSING TH~ TXR1529~ 12100401        28.9   -96.2 NON-POTW
 9 BLESSING TO~ TXR1569~ 12100401        28.7   -96.5 NON-POTW
10 BOCA CHICA ~ TX00982~ 12100401        28.7   -96.4 NON-POTW
# ... with 99 more rows
I can use this data_frame and purrr::pmap to retrieve discharge information. I will look up bacteria concentrations this time.
df <- df %>%
  filter(CWPFacilityTypeIndicator == "POTW") %>%
  select(p_id = SourceID)

reports <- downloadDMRs(df, idColumn = p_id,
                        parameter_code = "51040",
                        start_date = "01/01/2010",
                        end_date = "12/30/2017")
glimpse(reports)
Rows: 8
Columns: 2
$ p_id <chr> "TX0021474", "TX0023051", "TX0023167", "TX0105104", "TX~
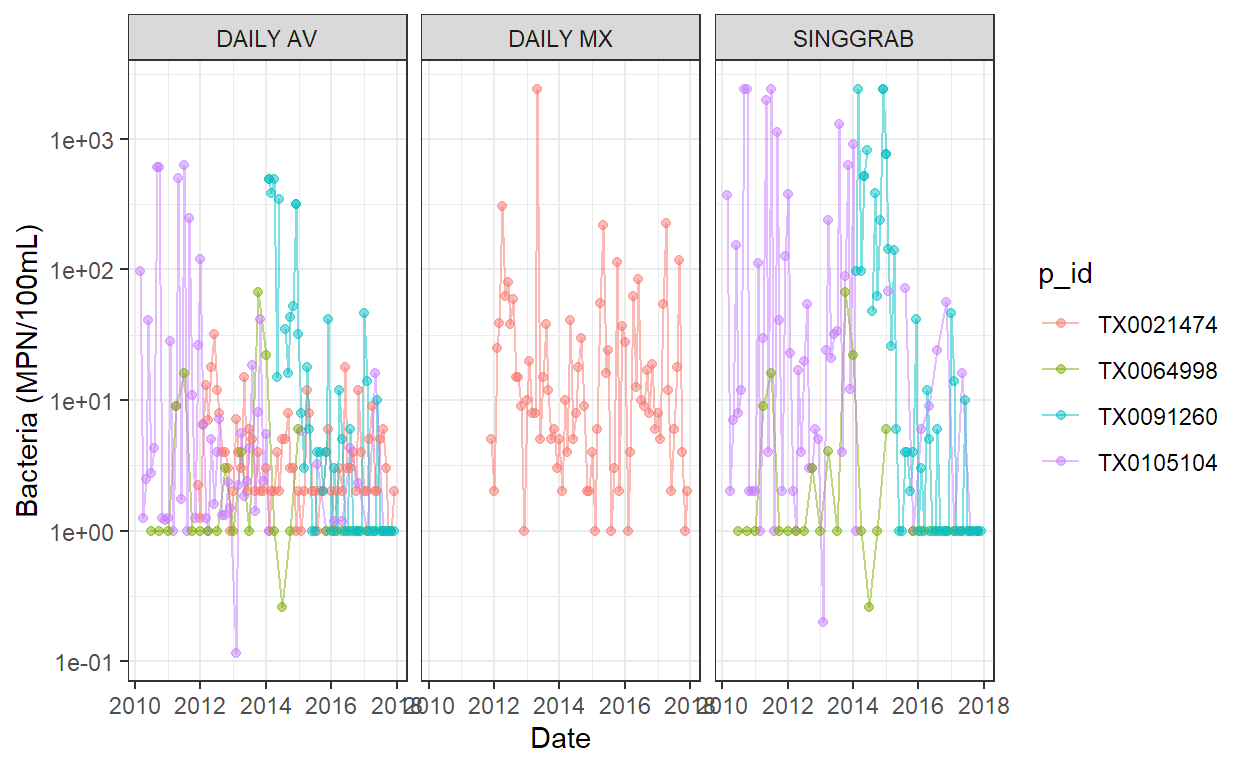
$ dmr <list> [<spec_tbl_df[146 x 61]>], [<spec_tbl_df[0 x 61]>], [<~Very quickly, we just found all the POTWs that discharge treated wastewater in the watershed of interest and pulled in their reported discharges. Now we can plot the data and call it a day.
reports <- reports %>%
  tidyr::unnest(dmr) %>%
  mutate(monitoring_period_end_date = as.Date(monitoring_period_end_date, "%m/%d/%Y"),
         dmr_value_nmbr = as.numeric(dmr_value_nmbr))

ggplot(reports) +
  geom_line(aes(monitoring_period_end_date, dmr_value_nmbr, color = p_id), alpha = 0.5) +
  geom_point(aes(monitoring_period_end_date, dmr_value_nmbr, color = p_id), alpha = 0.5) +
  facet_wrap(~statistical_base_short_desc) +
  scale_y_log10() +
  labs(x = "Date", y = "Bacteria (MPN/100mL)") +
  theme_bw()
ggplot(reports) +
  geom_density(aes(dmr_value_nmbr, fill = p_id, color = p_id), alpha = 0.5, trim = TRUE) +
  facet_wrap(~statistical_base_short_desc) +
  scale_x_log10(labels = scales::comma) +
  labs(x = "Bacteria (MPN/100mL)", y = "Density") +
  theme_bw()
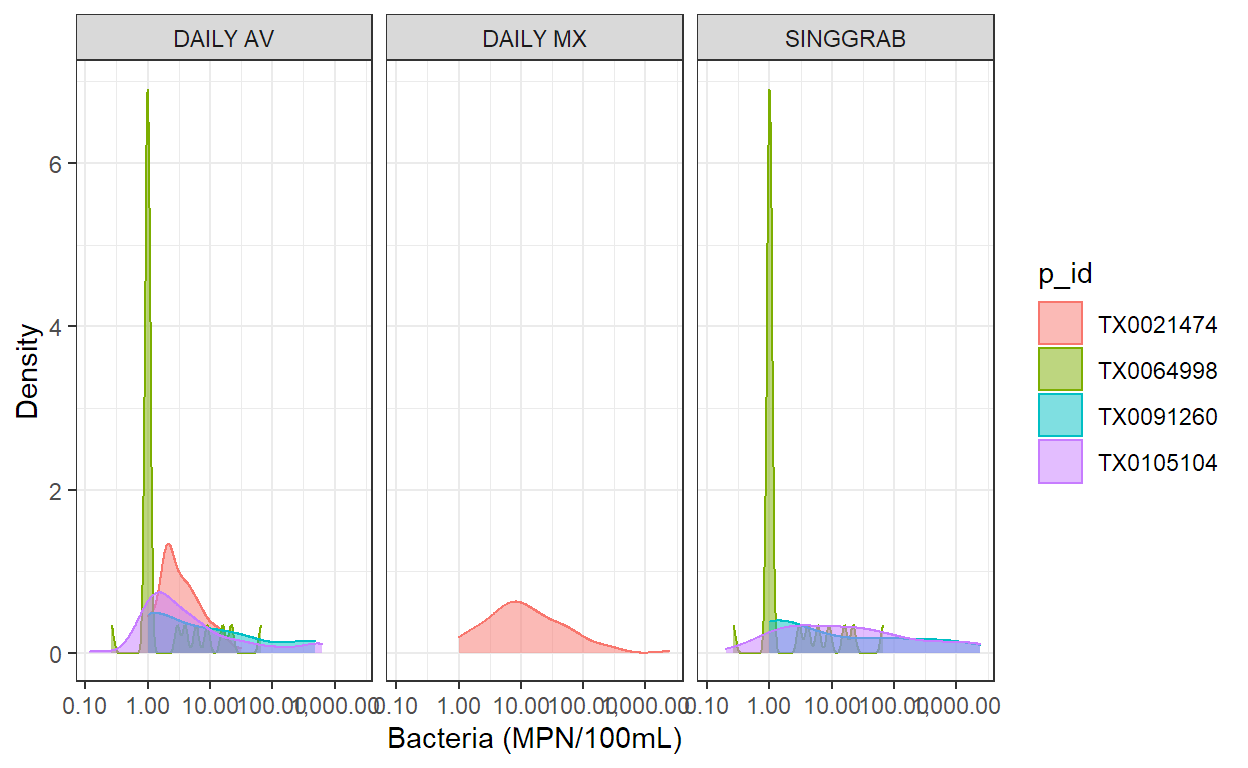
I was able to quickly generate some time series and density plots without ever touching the ECHO online user interface. There is plenty more documentation at:
https://mps9506.github.io/echor/index.html
If you have suggestions or problems, please report it at:
https://github.com/mps9506/echor/issues